圆形相关系数
简介
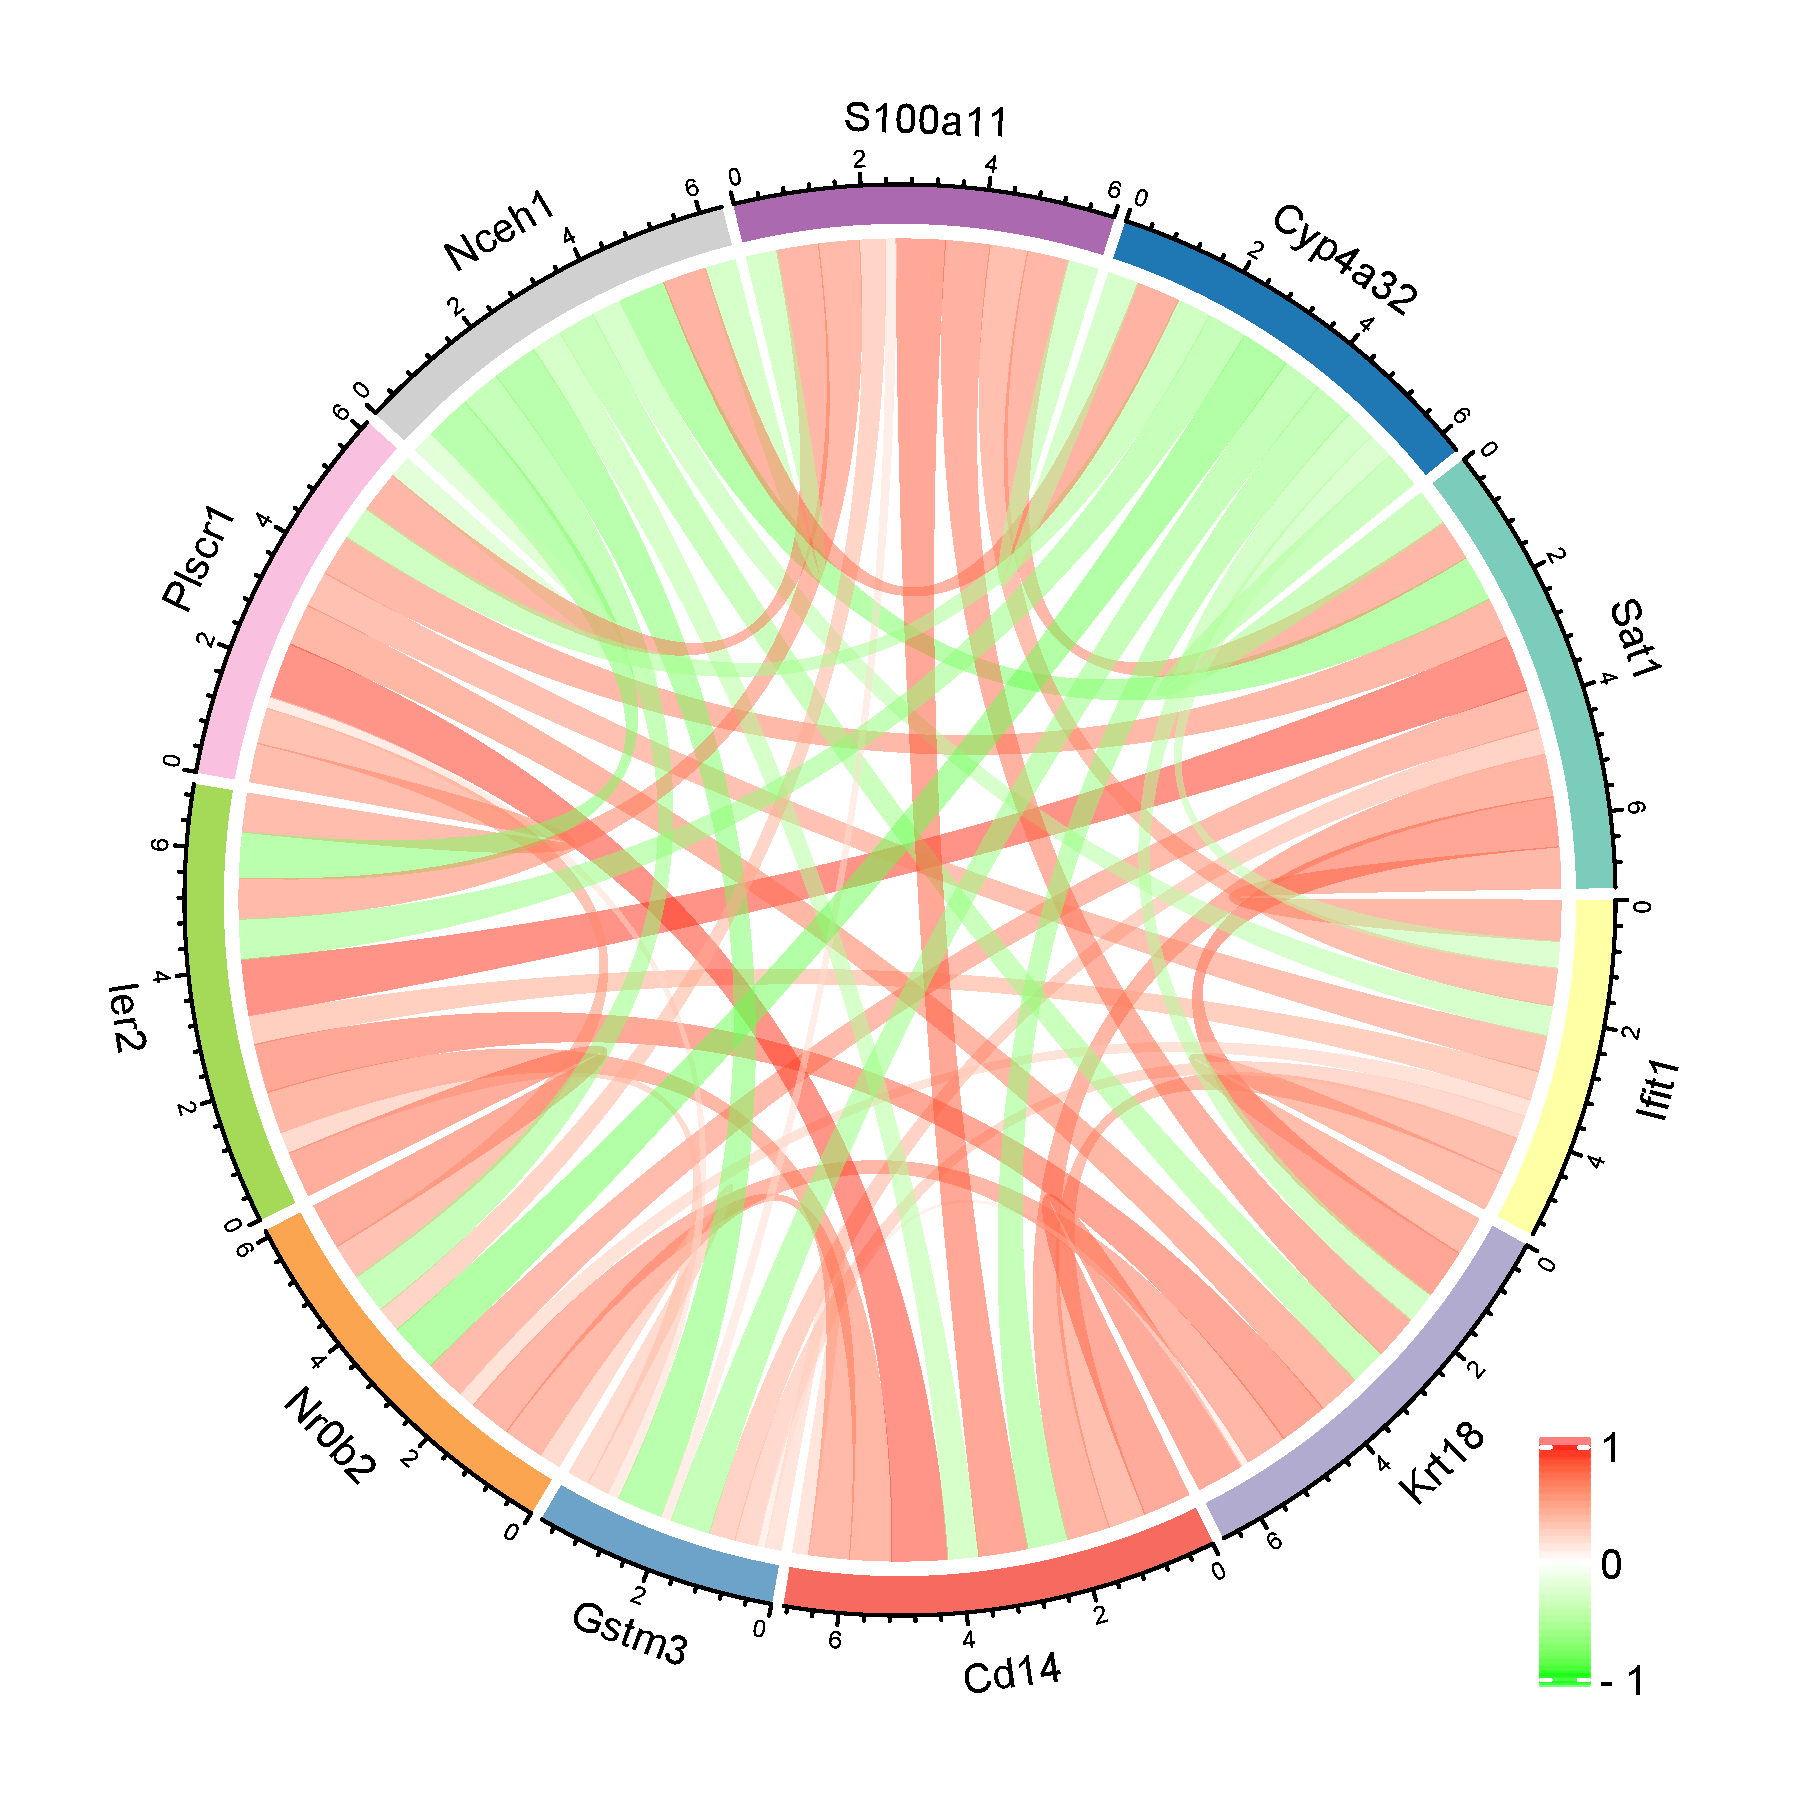
根据基因的表达值计算基因两两间的
相关系数,将相关系数矩阵结果用圆形展示,其中红色表示正相关,绿色表示负相关,外圈刻度表示该弧形下所有弦对应的相关系数绝对值的和。本质上是一个弦图。调用circlize R包。
数据说明
输入数据为矩阵形式,行为基因,列为样品(请自行转置)。
论文例子
CUL4B promotes prostate cancer progression by forming positive feedback loop with SOX4. Fig 3F
论文写作
Circos graph displaying the co-expression networks of Sat1 with 10 genes in cancer samples. Each sector of the circle
represents one gene, and its width indicates the total amount of co-occurrence that connects one certain gene to the other.
The width of each link represents the total co-expression times of the linked genes.
如何引用?
建议直接写网址。助力10000+篇
(google学术),9000+篇
(知网)论文
正式引用:Tang D, Chen M, Huang X, Zhang G, Zeng L, Zhang G, Wu S, Wang Y.
SRplot: A free online platform for data visualization and graphing. PLoS One. 2023 Nov 9;18(11):e0294236. doi: 10.1371/journal.pone.0294236. PMID: 37943830.
方法章节:Heatmap was plotted by https://www.bioinformatics.com.cn (last accessed on May 4, 2026), an online platform for data analysis and visualization.
致谢章节:We thank Mingjie Chen (Shanghai NewCore Biotechnology Co., Ltd.) for providing data analysis and visualization support.