pie+arc组合venn图
简介
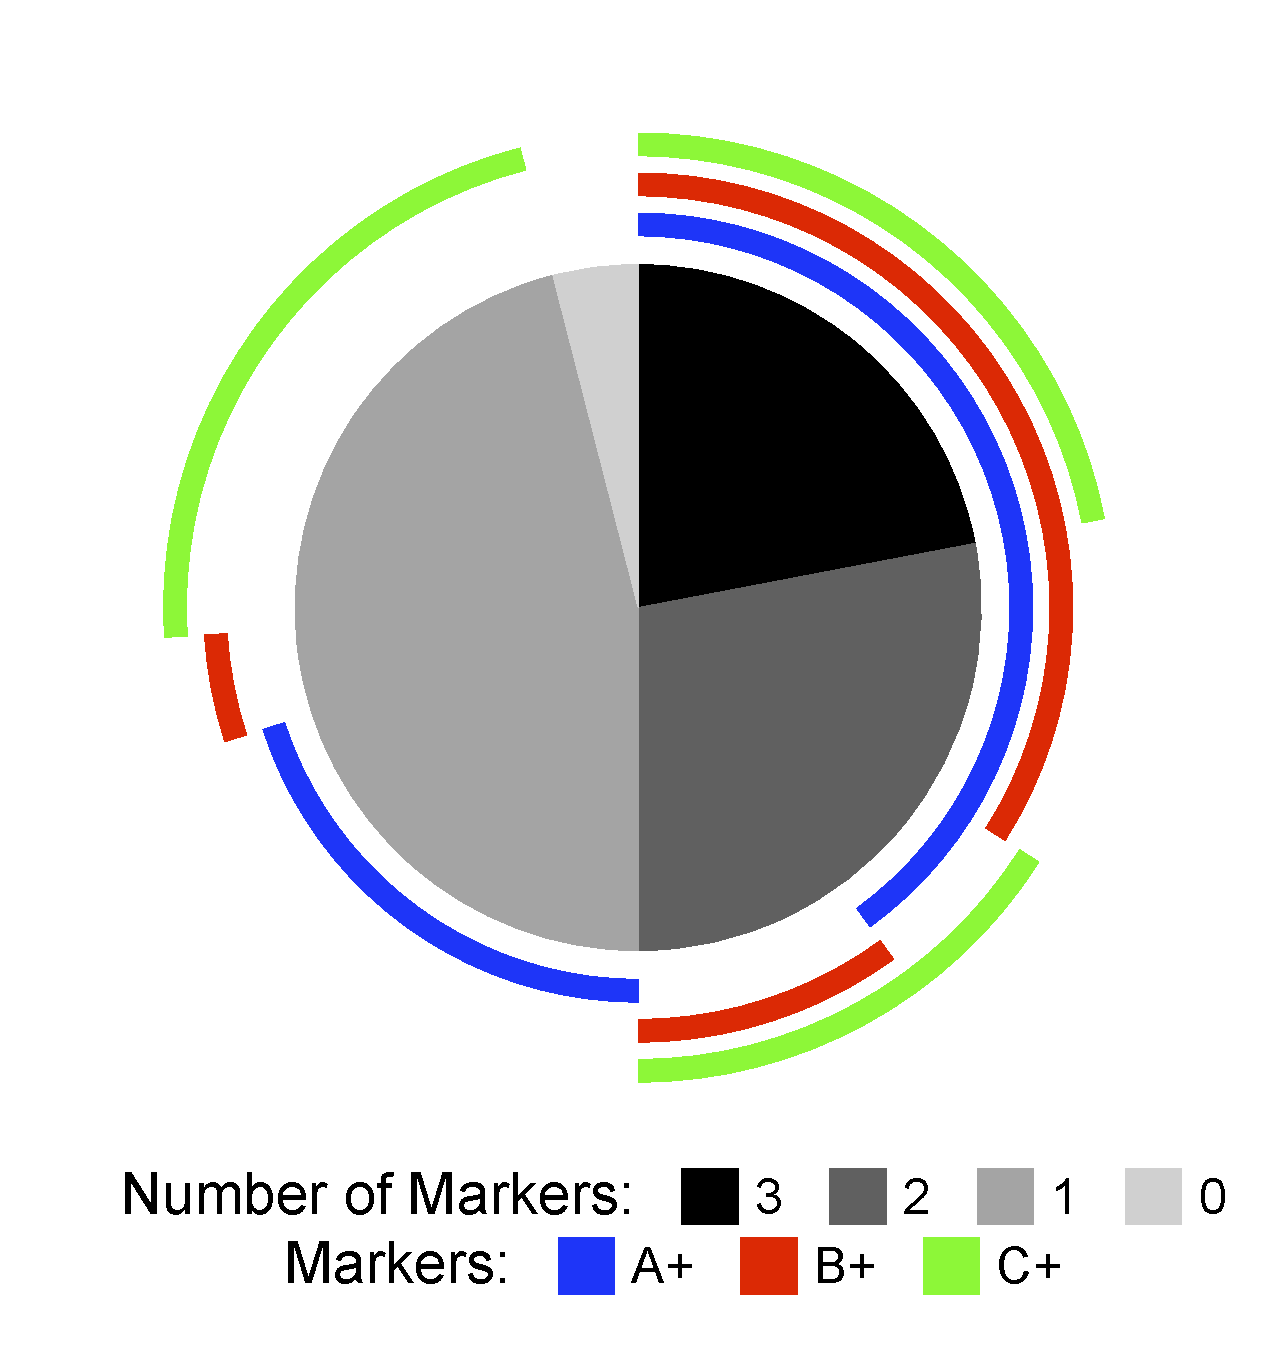
使用pie+arc展示不同特征(都没有,只在1个里边有,只在2个里边有等)的交集情况,与venn的性质一样。不同的arc轨道表示不同的特征,pie表示特征的交集情况。以示例为例,展示了50个细胞的3个marker表达情况。从内到外依次是pie,marker1,marker2,marker3。其中pie分成了3+1=4部分:0表示所有marker都没有的细胞占比,1表示至少1个marker的细胞占比;2表示至少2个marker的细胞占比;3表示3个marker都有的细胞占比。外侧的arc表示交集情况,从圆心向外辐射,如果有3条arc轨道,就是3个marker都有;有2条arc轨道,就是2个marker都有;有1个arc轨道,就是1个marker都有的;没有arc轨道,就是3个marker都没有
数据说明
输入为1+N列(N最多6个)。第一列是细胞(或者基因等),第2+列是不同的marker(或者GO条目)。除了第一行和第一列外,其他单元格必须是0或者1,0表示不表达这个marker(不在,不属于),1表示表达这个marker(在,属于)。
论文例子
4-1BB costimulation ameliorates T cell exhaustion induced by tonic signaling of chimeric antigen receptors. Fig2f
如何引用?
建议直接写网址。助力10000+篇
(google学术),9000+篇
(知网)论文
正式引用:Tang D, Chen M, Huang X, Zhang G, Zeng L, Zhang G, Wu S, Wang Y.
SRplot: A free online platform for data visualization and graphing. PLoS One. 2023 Nov 9;18(11):e0294236. doi: 10.1371/journal.pone.0294236. PMID: 37943830.
方法章节:Heatmap was plotted by https://www.bioinformatics.com.cn (last accessed on May 4, 2026), an online platform for data analysis and visualization.
致谢章节:We thank Mingjie Chen (Shanghai NewCore Biotechnology Co., Ltd.) for providing data analysis and visualization support.