堆叠bar图(stack bar plot)
简介
堆叠柱状图,一般用于描述百分比。
数据说明
数据为矩阵形式:第一行是名字,其他行是名字对应的数值
论文例子
Metatranscriptomic response of the wheat holobiont to decreasing soil water content. fig1b
| 输入 |
person	Mon	Tue	Wed	Thu	Fri	Sat	Sun
Ann	820	254	164	481	164	852	952
Bob	932	248	167	492	254	654	1025
Carl 901 641 481 164 154 164 1520 |
| 输出 |
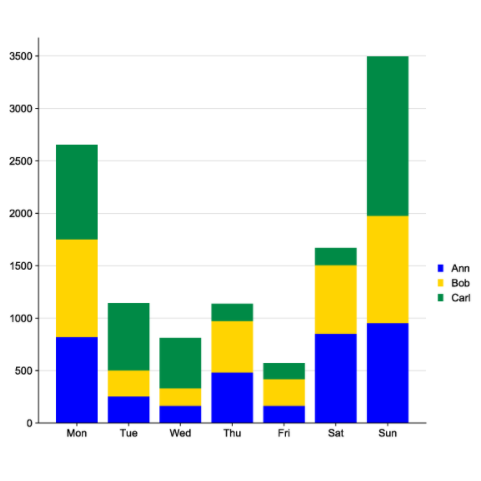
|
如何引用?
建议直接写网址。助力10000+篇
(google学术),9000+篇
(知网)论文
正式引用:Tang D, Chen M, Huang X, Zhang G, Zeng L, Zhang G, Wu S, Wang Y.
SRplot: A free online platform for data visualization and graphing. PLoS One. 2023 Nov 9;18(11):e0294236. doi: 10.1371/journal.pone.0294236. PMID: 37943830.
方法章节:Heatmap was plotted by https://www.bioinformatics.com.cn (last accessed on May 4, 2026), an online platform for data analysis and visualization.
致谢章节:We thank Mingjie Chen (Shanghai NewCore Biotechnology Co., Ltd.) for providing data analysis and visualization support.
