t-SNE降维
简介
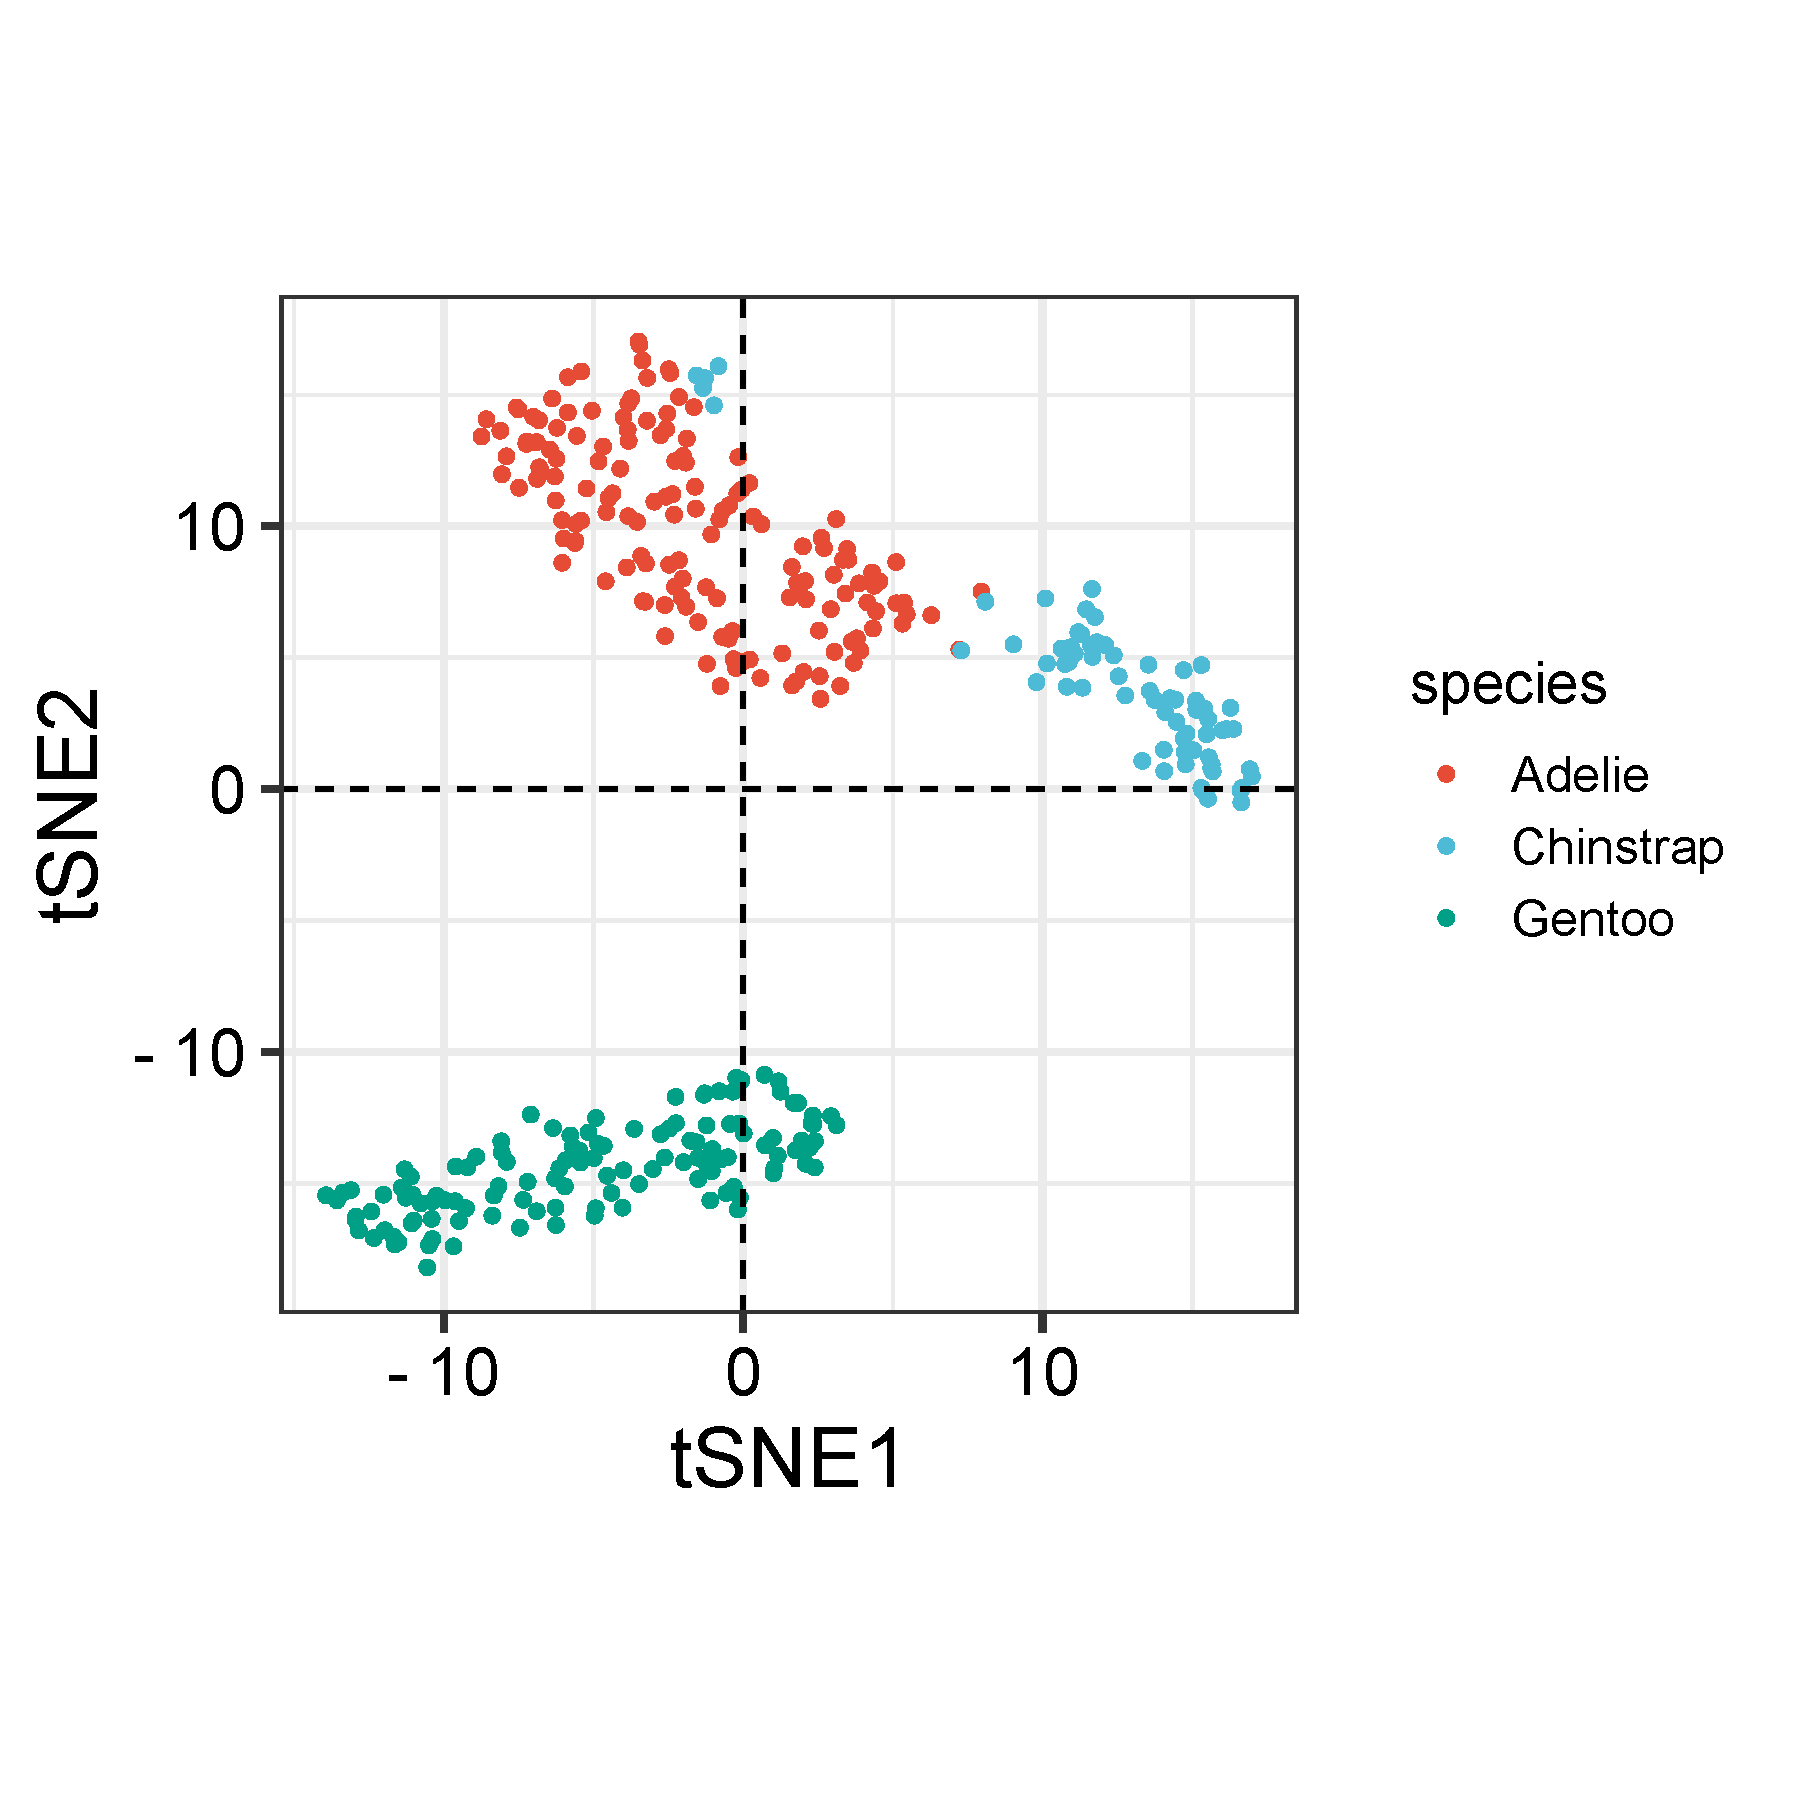
t-SNE(t-Distributed Stochastic Neighbor Embedding)是一种非线性降维算法,广泛用于单细胞等数据降维,能够很好地将高维数据降维到2维,并进行可视化。
数据说明
数据为矩阵形式,行为样品(例如细胞),列为特征(feature,例如基因)。第二列为分组
论文例子
Integrated analysis of cervical squamous cell carcinoma cohorts from three continents reveals conserved subtypes of prognostic significance Fig2c
如何引用?
建议直接写网址。助力10000+篇
(google学术),9500+篇
(知网)论文
正式引用:Tang D, Chen M, Huang X, Zhang G, Zeng L, Zhang G, Wu S, Wang Y.
SRplot: A free online platform for data visualization and graphing. PLoS One. 2023 Nov 9;18(11):e0294236. doi: 10.1371/journal.pone.0294236. PMID: 37943830.
方法章节:Heatmap was plotted by https://www.bioinformatics.com.cn (last accessed on May 4, 2026), an online platform for data analysis and visualization.
致谢章节:We thank Mingjie Chen (Shanghai NewCore Biotechnology Co., Ltd.) for providing data analysis and visualization support.