scRNA-seq marker基因火山图
简介
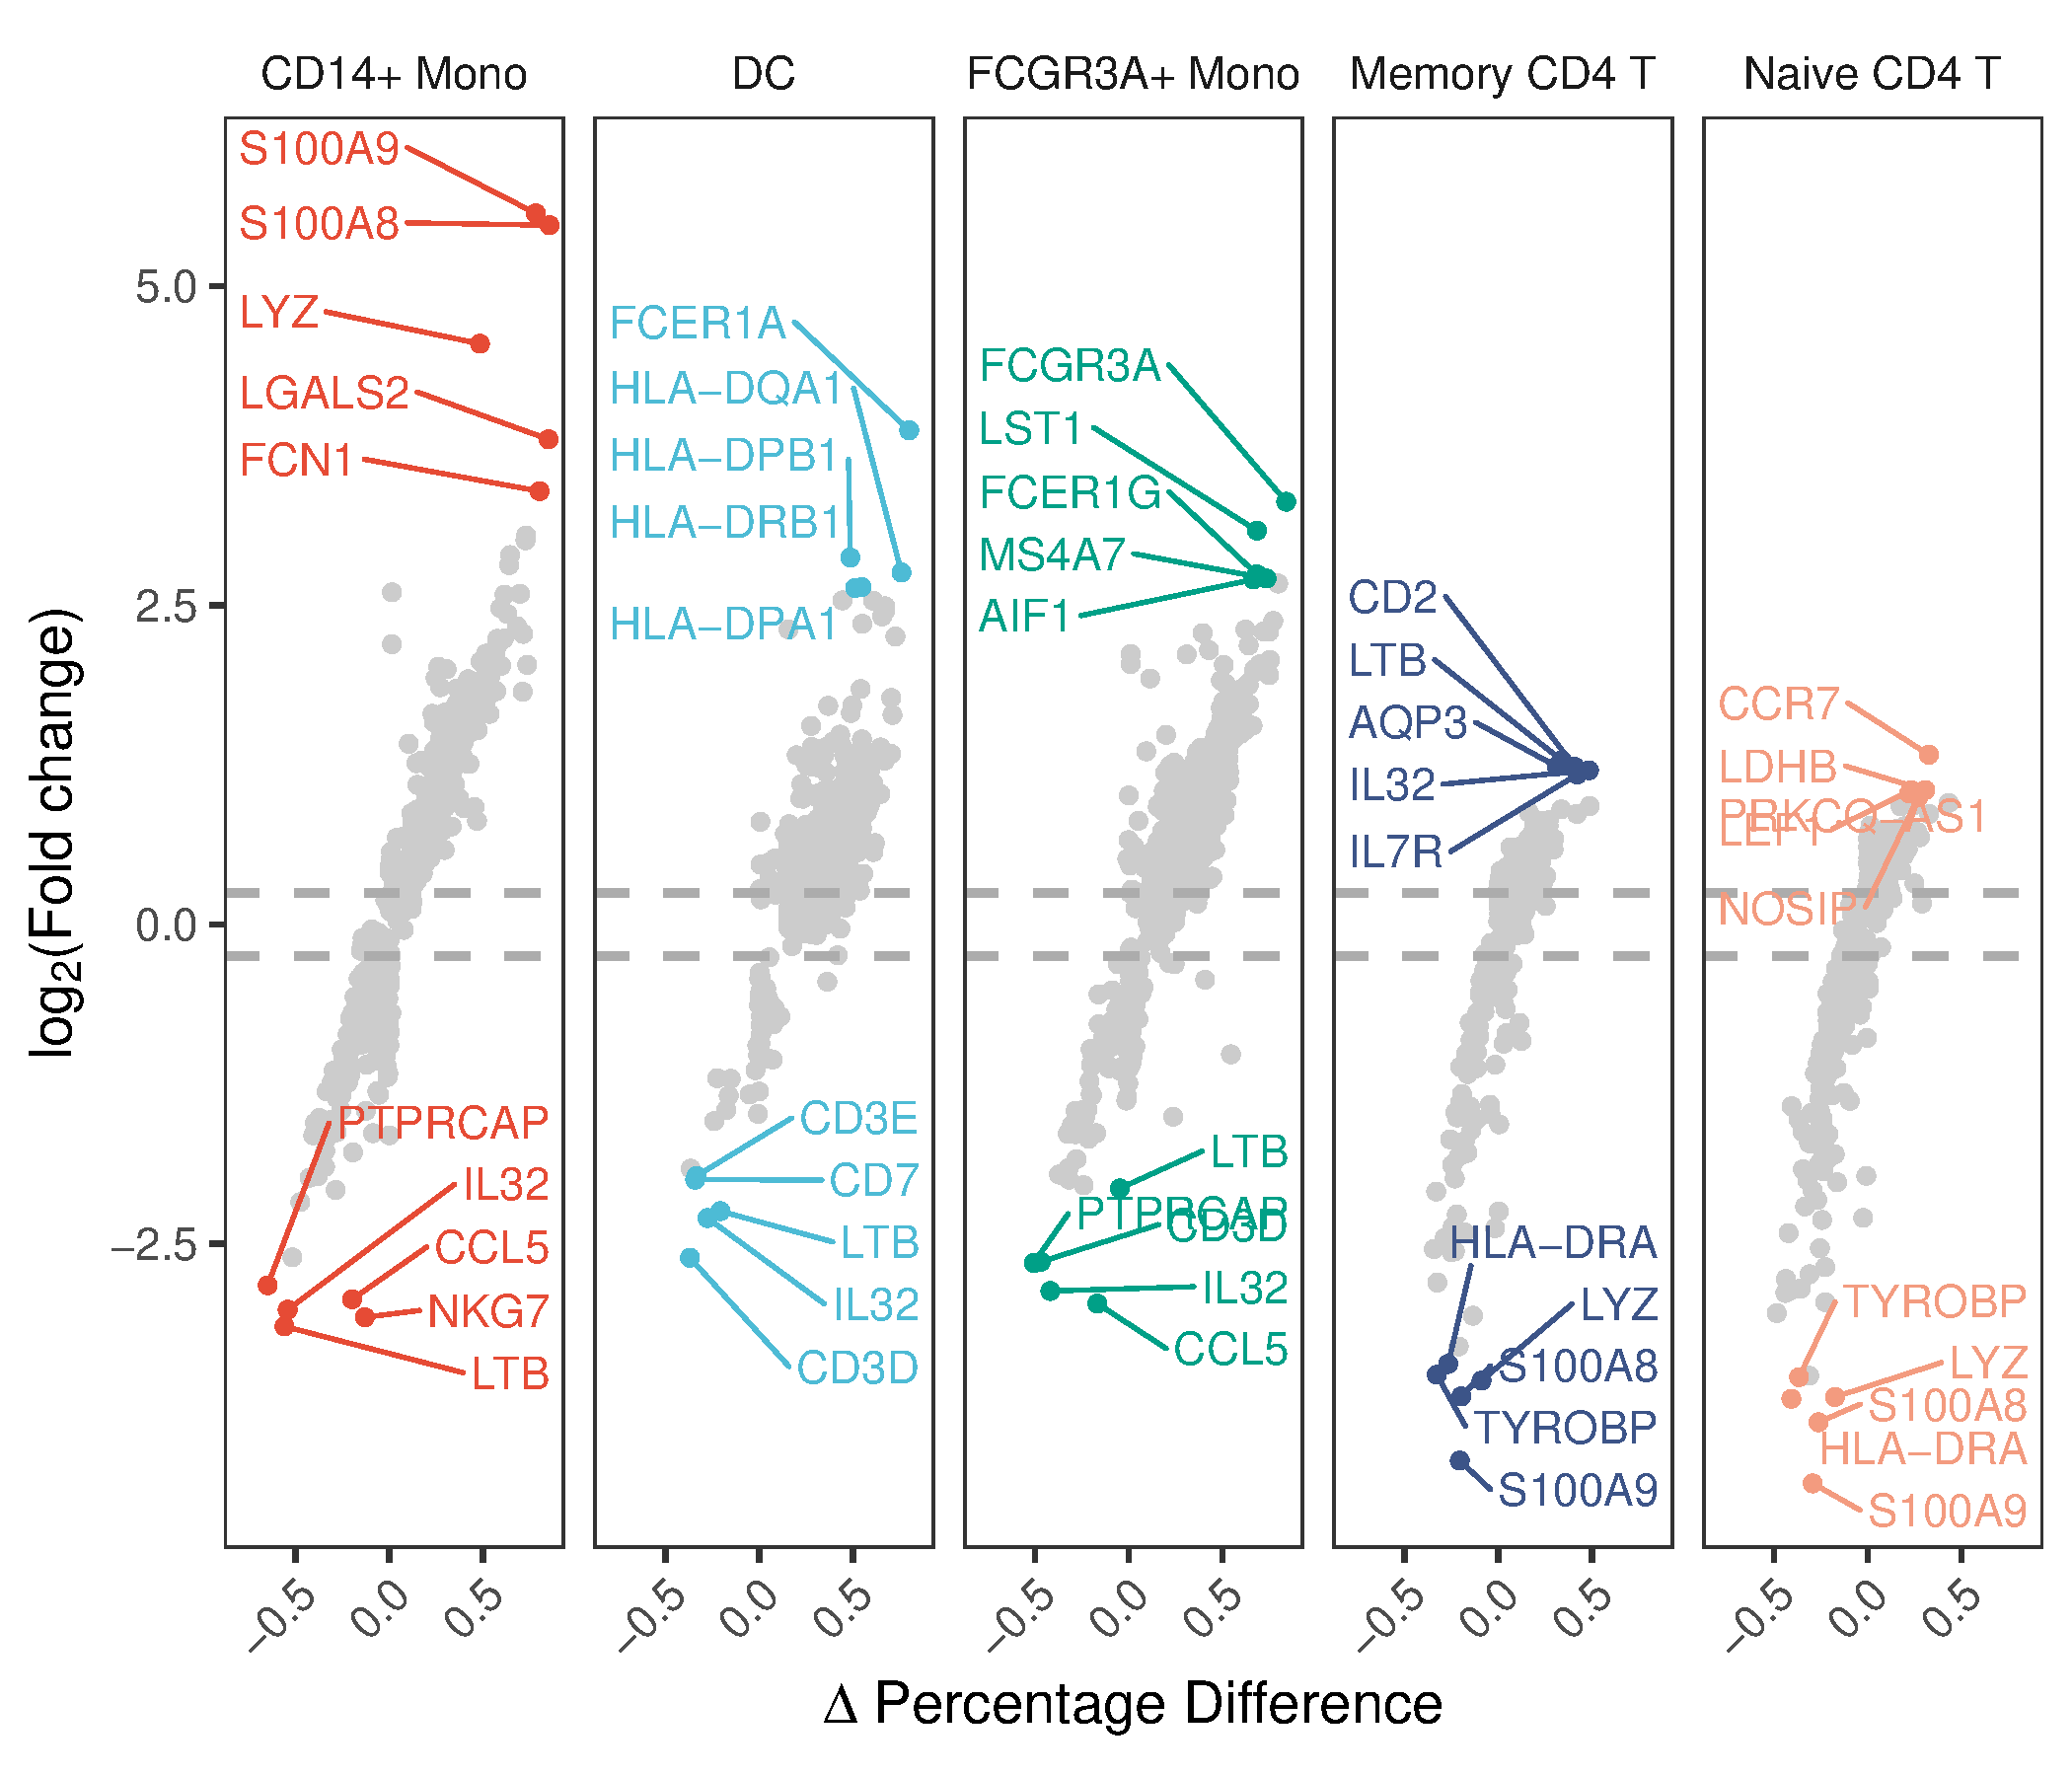
scRNA-seq火山图是多个cluster(vs 其他cluster)的并排火山图。X轴是基因表达细胞占比的变化(pct.1 - pct.2),变化越大,越靠两边;Y轴是log2FC,越大越向上下两侧。注:这里没有体现p值。调用scRNAtoolVis R包
数据说明
输入数据为5列:第1列avg_log2FC;第2列是pct.1;第3列是pct.2;第4列是cluster(细胞簇名);第5列是marker基因。
论文例子
A Spatiotemporal Organ-Wide Gene Expression and Cell Atlas of the Developing Human Heart
如何引用?
建议直接写网址。助力10000+篇
(google学术),9000+篇
(知网)论文
正式引用:Tang D, Chen M, Huang X, Zhang G, Zeng L, Zhang G, Wu S, Wang Y.
SRplot: A free online platform for data visualization and graphing. PLoS One. 2023 Nov 9;18(11):e0294236. doi: 10.1371/journal.pone.0294236. PMID: 37943830.
方法章节:Heatmap was plotted by https://www.bioinformatics.com.cn (last accessed on May 4, 2026), an online platform for data analysis and visualization.
致谢章节:We thank Mingjie Chen (Shanghai NewCore Biotechnology Co., Ltd.) for providing data analysis and visualization support.