山脊图(ridgeline plot, joyplot)
简介
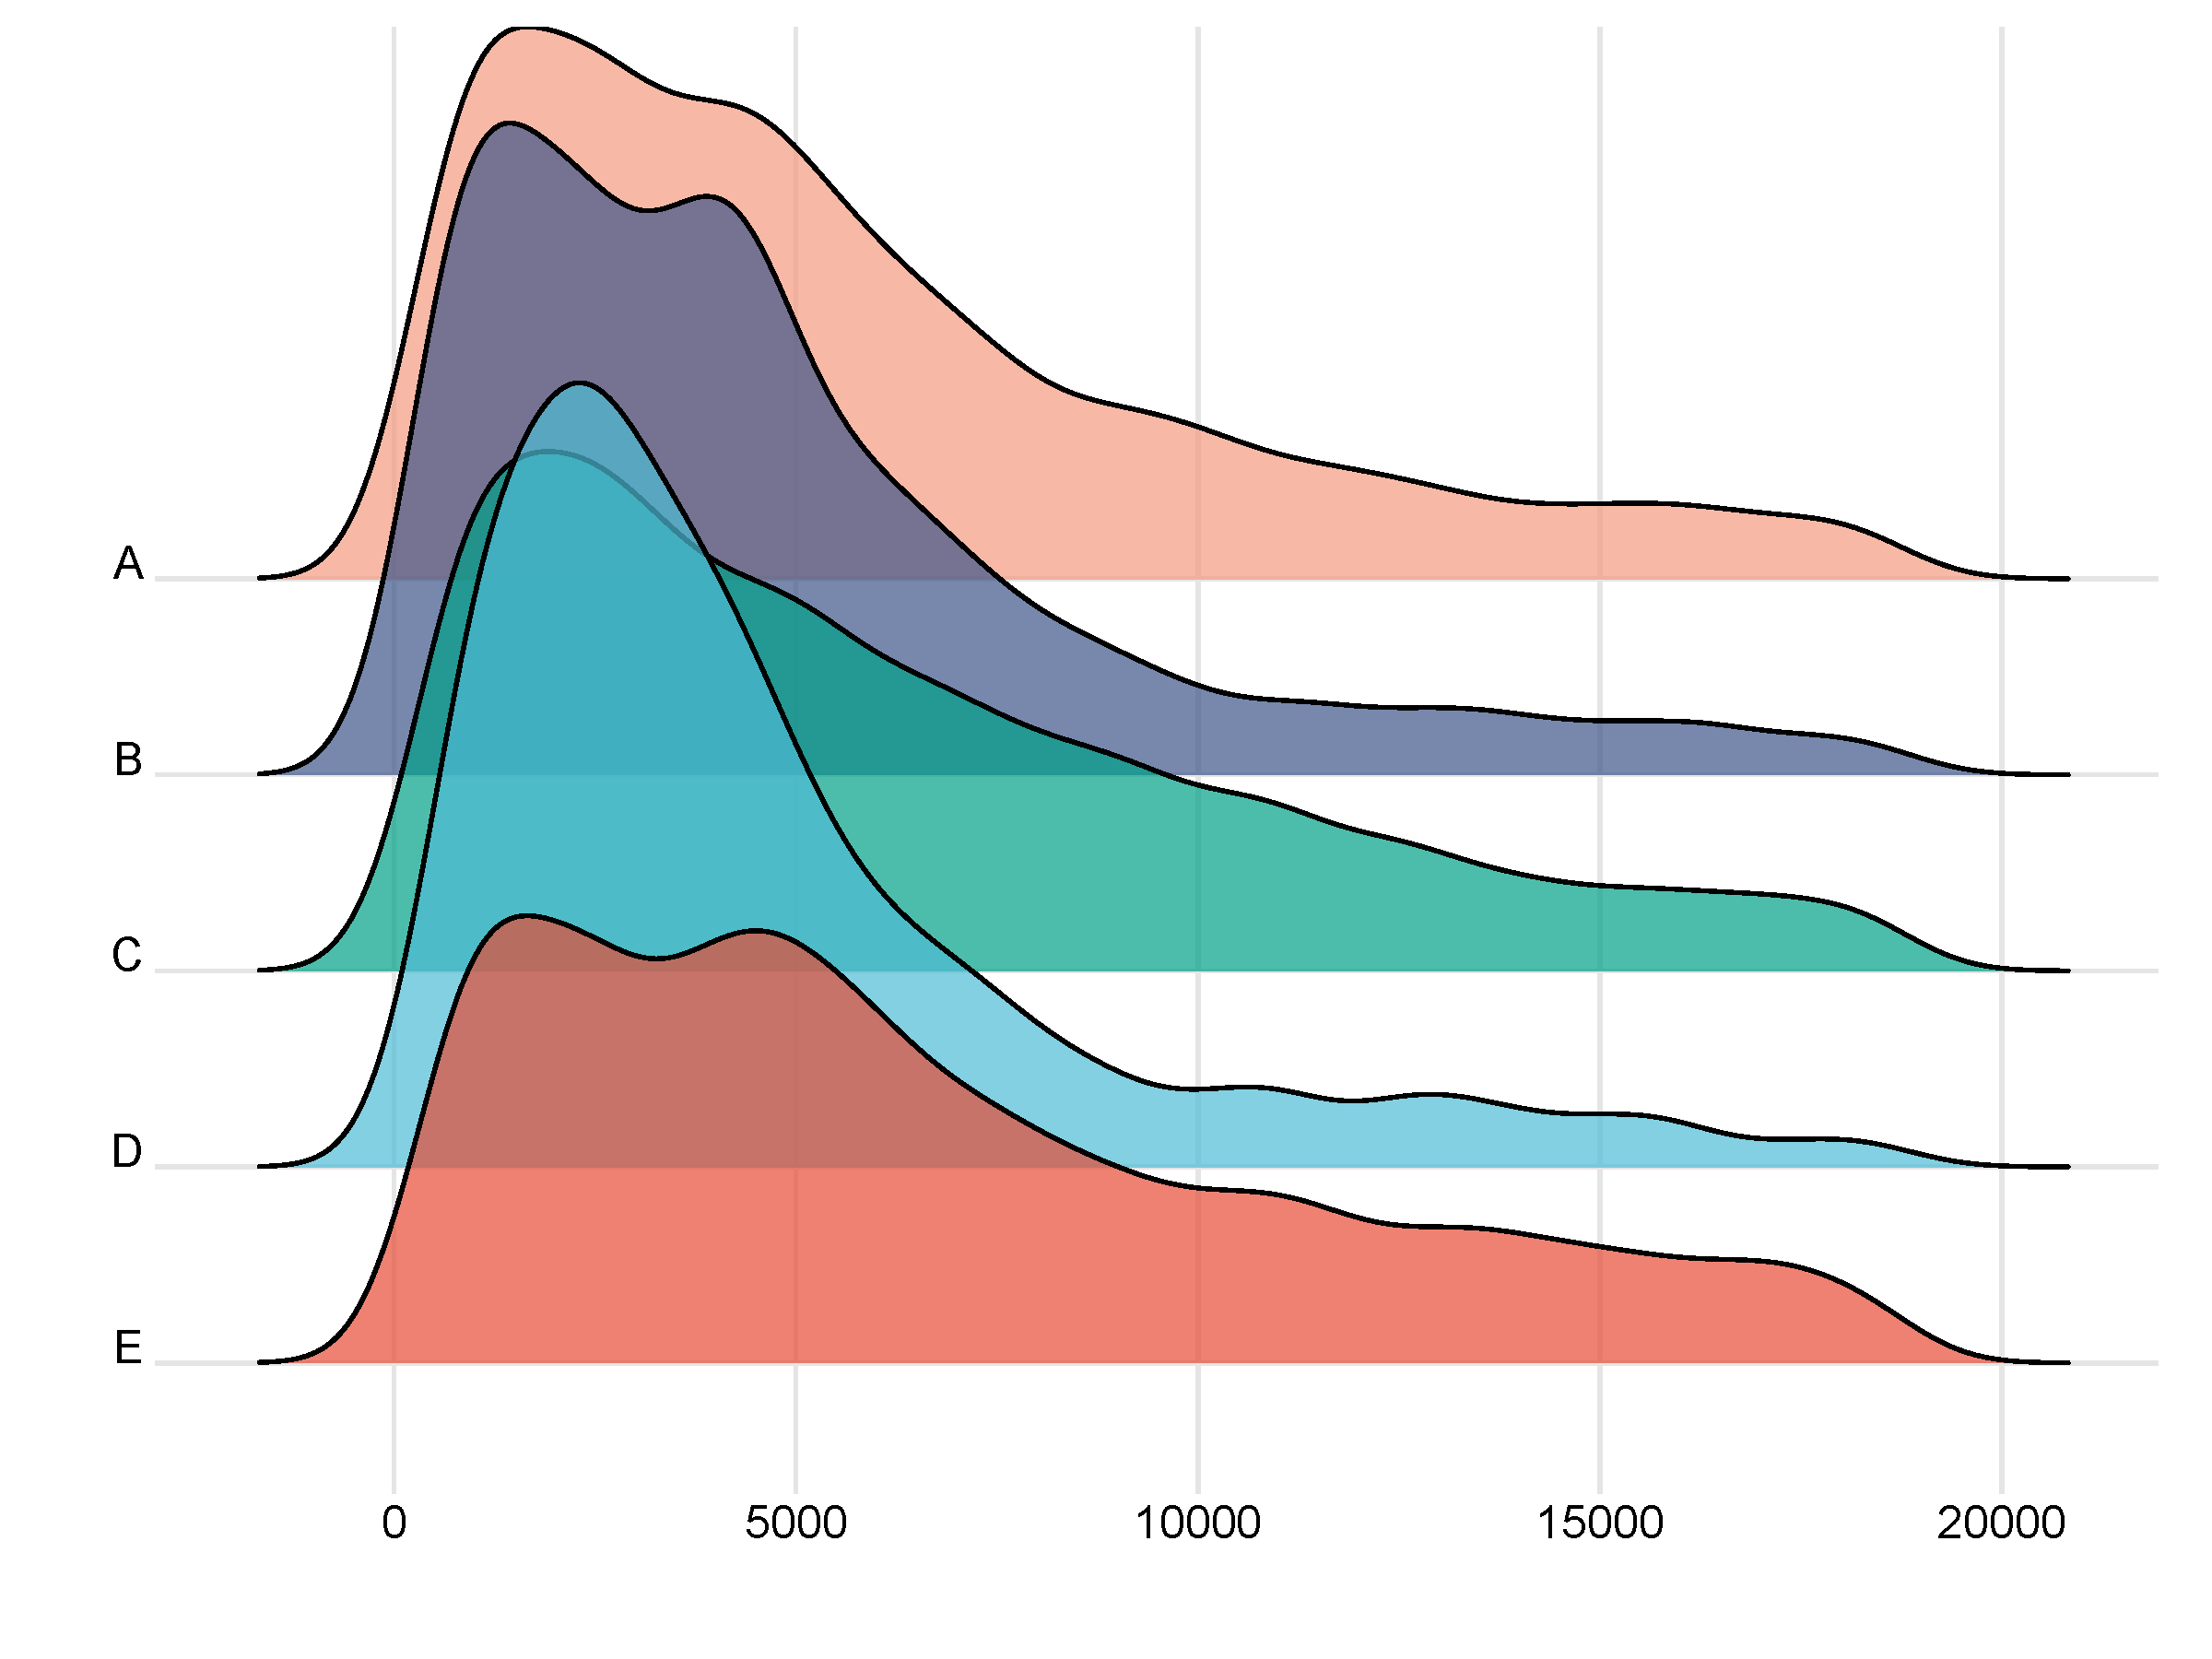
山脊图一般由多个彼此重叠的密度图组成,在有限的空间上,以类3D的形式非常紧凑地展示数据。调用ggridge包。
数据说明
第一列为样品名(或基因名),第二列为数值。
论文例子
Exercise reprograms the inflammatory landscape of multiple stem cell compartments during mammalian aging. fig S1g
如何引用?
建议直接写网址。助力10000+篇
(google学术),9000+篇
(知网)论文
正式引用:Tang D, Chen M, Huang X, Zhang G, Zeng L, Zhang G, Wu S, Wang Y.
SRplot: A free online platform for data visualization and graphing. PLoS One. 2023 Nov 9;18(11):e0294236. doi: 10.1371/journal.pone.0294236. PMID: 37943830.
方法章节:Heatmap was plotted by https://www.bioinformatics.com.cn (last accessed on May 4, 2026), an online platform for data analysis and visualization.
致谢章节:We thank Mingjie Chen (Shanghai NewCore Biotechnology Co., Ltd.) for providing data analysis and visualization support.