pathview渲染kegg pathway map
简介
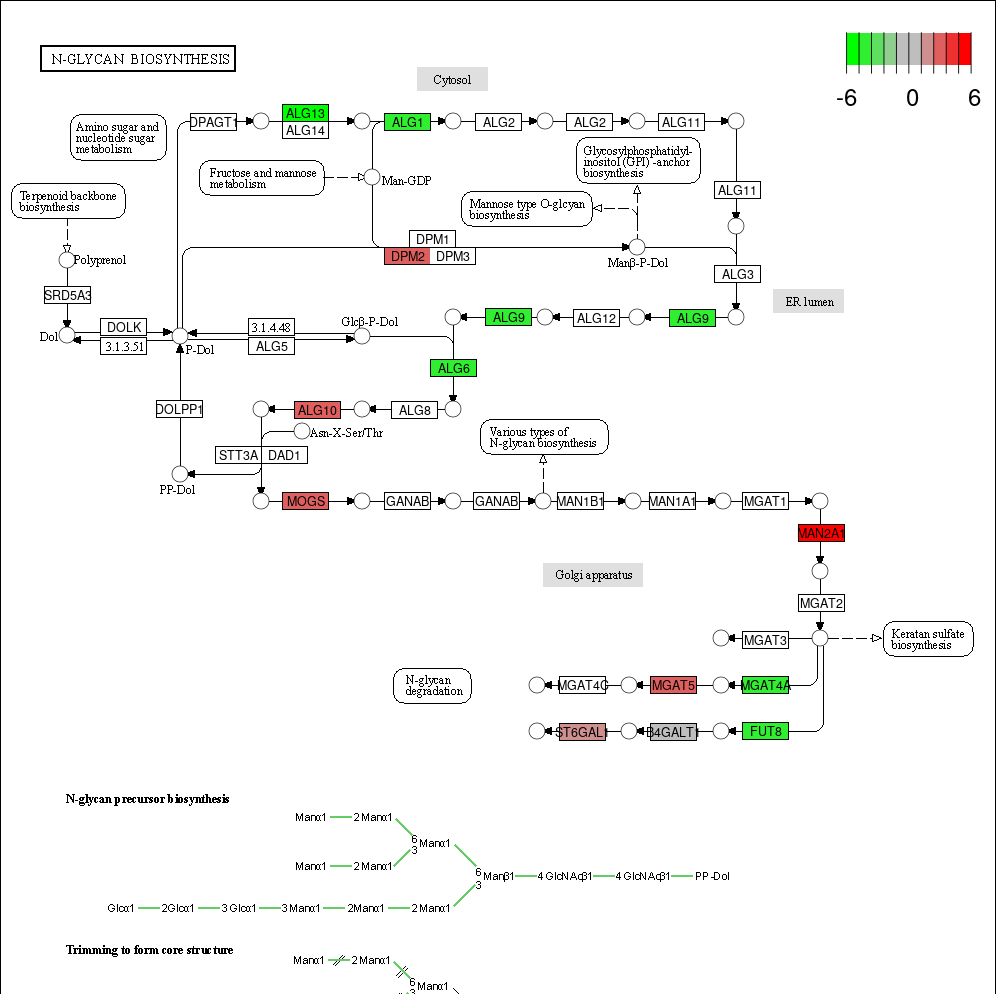
使用Pathview R包重新渲染KEGG Pathway map。根据输入数据,在相关基因或者化合物对应的框上加上不同的颜色,整合KEGG pathway map图、基因表达,代谢组等信息。
The pathview downloads and uses KEGG data. Non-academic uses may require a KEGG license agreement (details at http://www.kegg.jp/kegg/legal.html).
数据说明
输入为两列:第一列是基因id或者化合物id或者药物id。其中基因id来自该KEGG pathway页面Gene栏最左侧的id(绝大部分是纯数字的entrez基因id,也有不是纯数字的基因id);化合物id来自Compound栏最左侧的id(C开头);药物id来自Drug栏最左侧的id(D开头),第二列是数值(此数值只要有意义就行,不一定非得是log2fc,也可以是表达值,甲基化程度等等)。
其中,第一行第一列为KEGG ID,可以在
KEGG官网查询,例如NF-kappa B signaling pathway - Homo sapiens (human)对应的KEGG ID为hsa04064。
第一行第二列为log2FC(可以随便写,但是不要有特殊符号)。
更多高级应用,请参考pathview官方网站(https://pathview.uncc.edu/)
论文例子
Characterization of Stem-like Circulating Tumor Cells in Pancreatic Cancer Fig 5C.
如何引用?
建议直接写网址。助力10000+篇
(google学术),9000+篇
(知网)论文
正式引用:Tang D, Chen M, Huang X, Zhang G, Zeng L, Zhang G, Wu S, Wang Y.
SRplot: A free online platform for data visualization and graphing. PLoS One. 2023 Nov 9;18(11):e0294236. doi: 10.1371/journal.pone.0294236. PMID: 37943830.
方法章节:Heatmap was plotted by https://www.bioinformatics.com.cn (last accessed on May 4, 2026), an online platform for data analysis and visualization.
致谢章节:We thank Mingjie Chen (Shanghai NewCore Biotechnology Co., Ltd.) for providing data analysis and visualization support.