水平堆叠bar图(horizontal stack bar plot)
简介
数据说明
数据为两行:第一行是名字,第二行是名字对应的数值。
论文例子
The Shared Mechanism and Candidate Drugs of Multiple Sclerosis and Sjögren’s Syndrome Analyzed by Bioinformatics Based on GWAS and Transcriptome Data
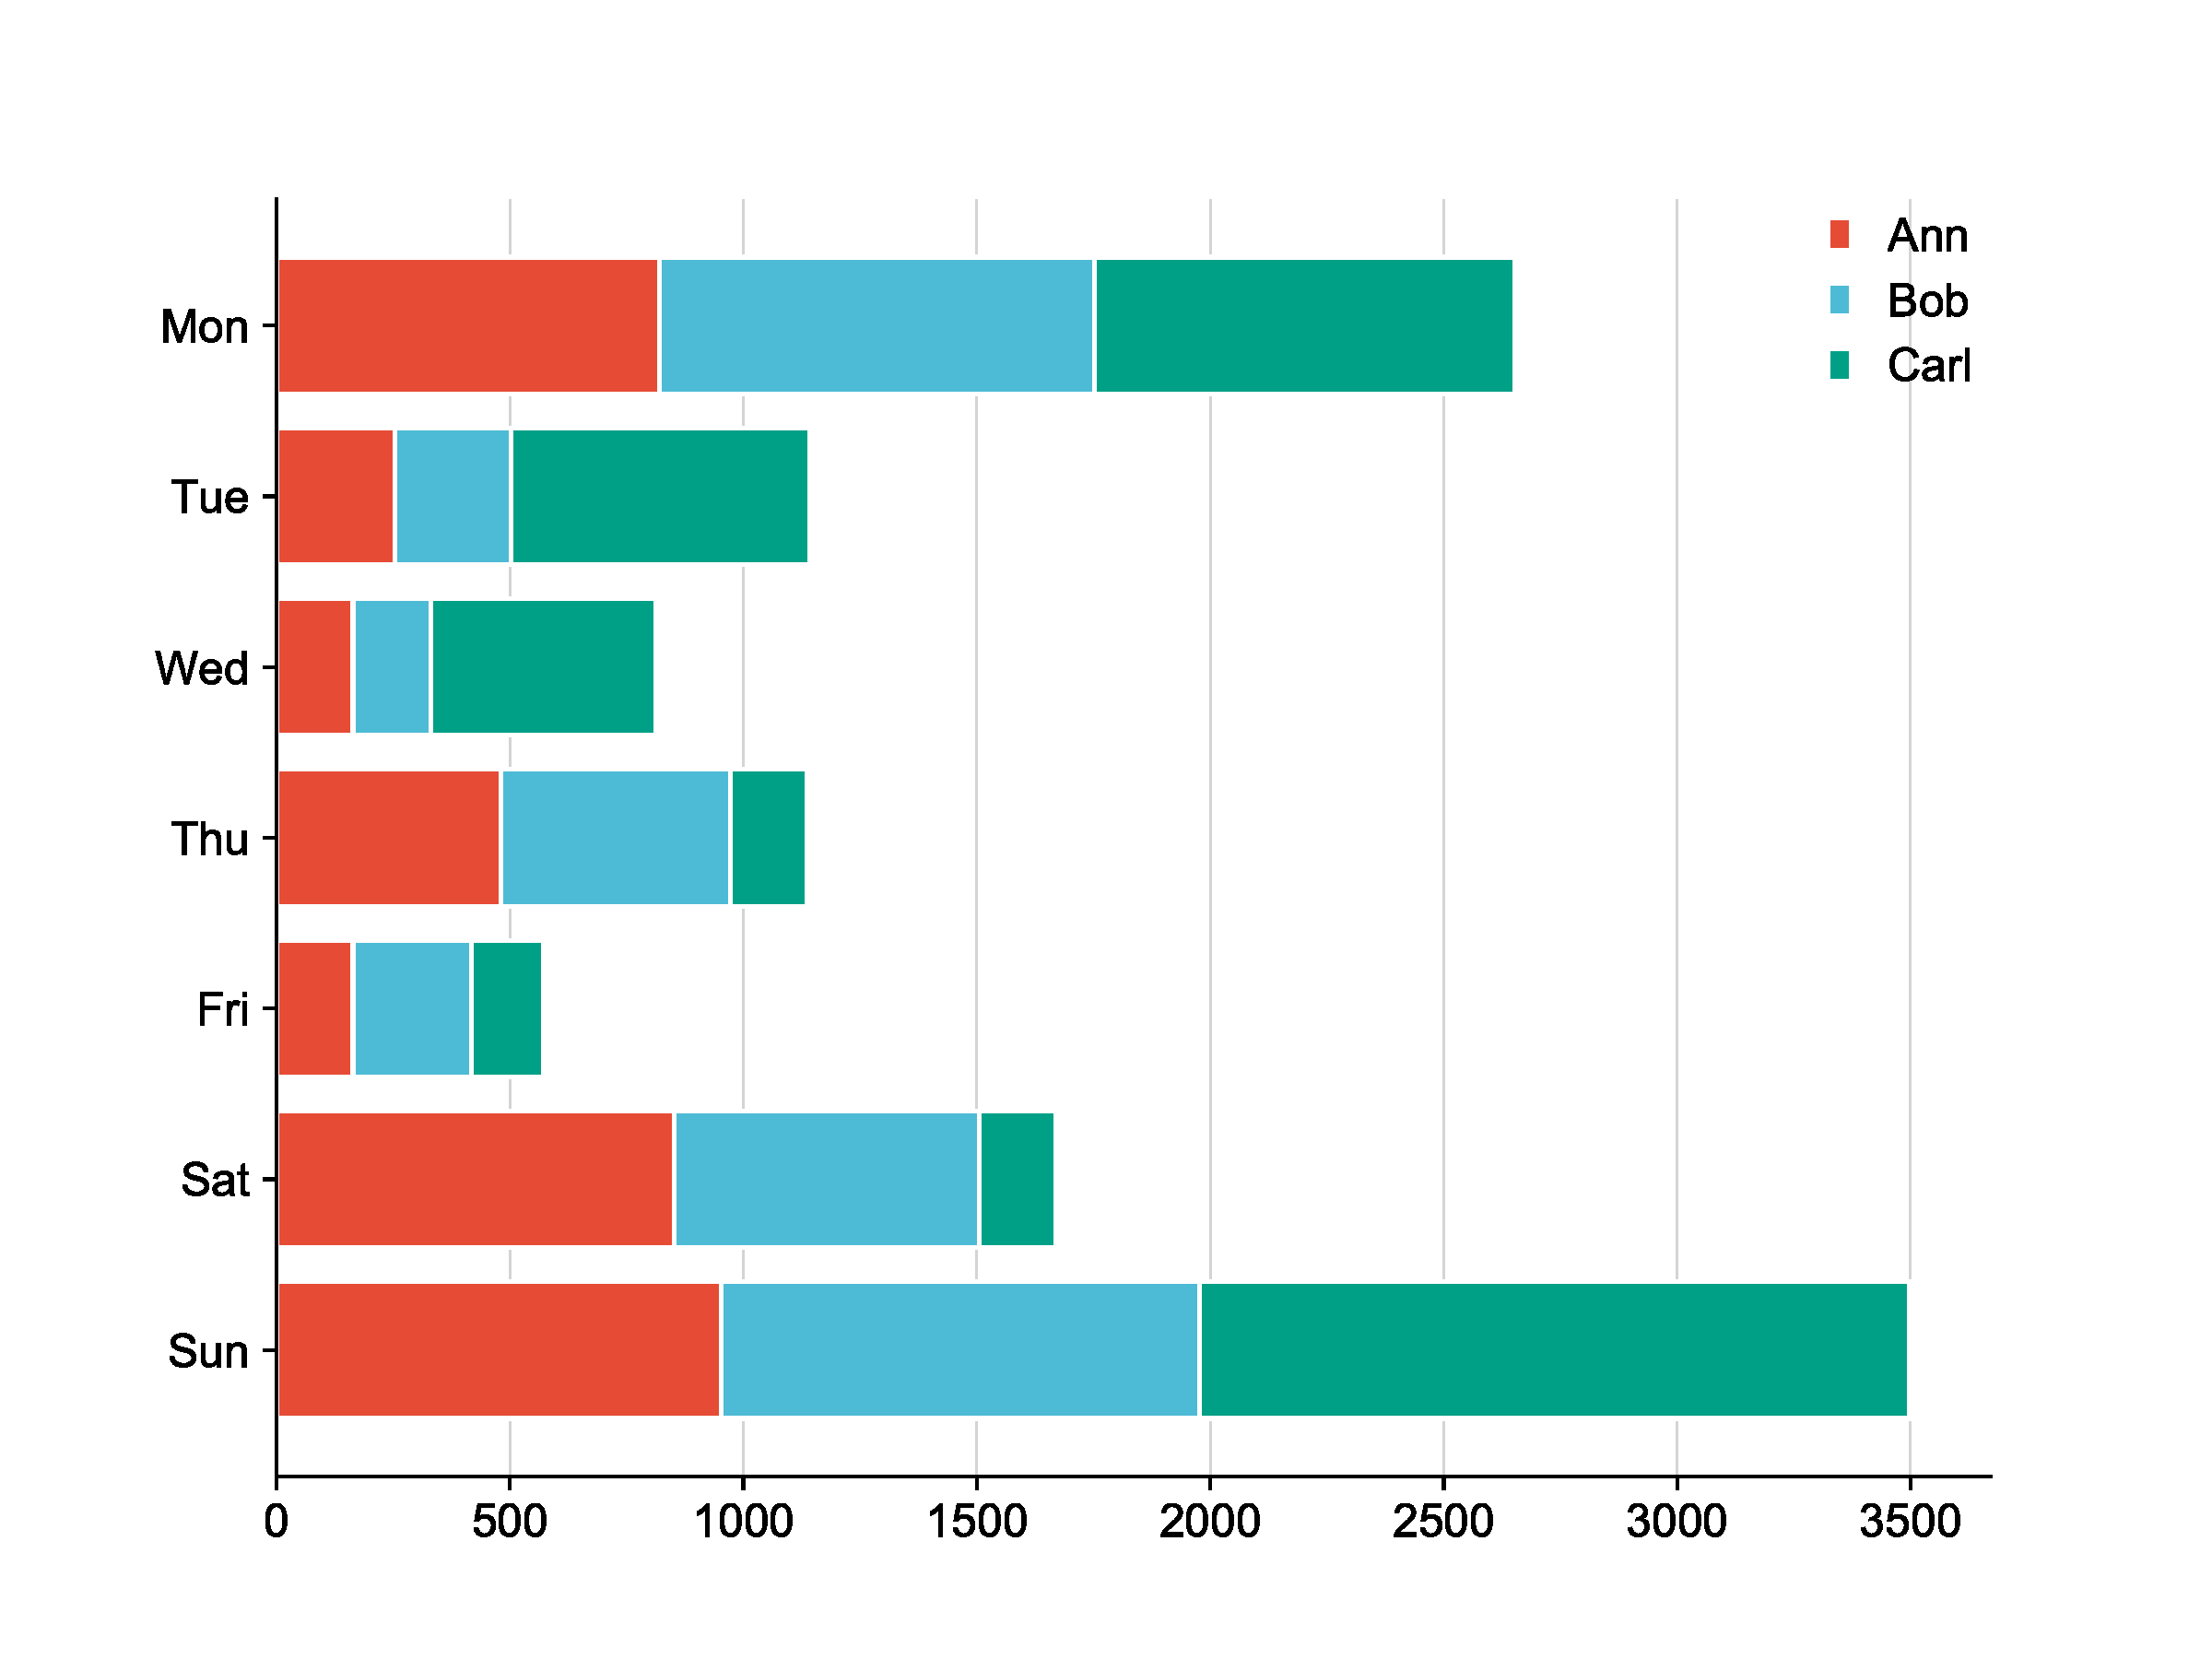
| 输入 |
person	Ann	Bob	Carl
Mon	820	932	901
Tue	254	248	641
Wed	164	167	481
Thu	481	492	164
Fri	164	254	154
Sat	852	654	164
Sun 952 1025 1520 |
| 输出 |
|
如何引用?
建议直接写网址。助力10000+篇
(google学术),9000+篇
(知网)论文
正式引用:Tang D, Chen M, Huang X, Zhang G, Zeng L, Zhang G, Wu S, Wang Y.
SRplot: A free online platform for data visualization and graphing. PLoS One. 2023 Nov 9;18(11):e0294236. doi: 10.1371/journal.pone.0294236. PMID: 37943830.
方法章节:Heatmap was plotted by https://www.bioinformatics.com.cn (last accessed on May 4, 2026), an online platform for data analysis and visualization.
致谢章节:We thank Mingjie Chen (Shanghai NewCore Biotechnology Co., Ltd.) for providing data analysis and visualization support.
