GSEA,GSVA结果双向条形图
简介
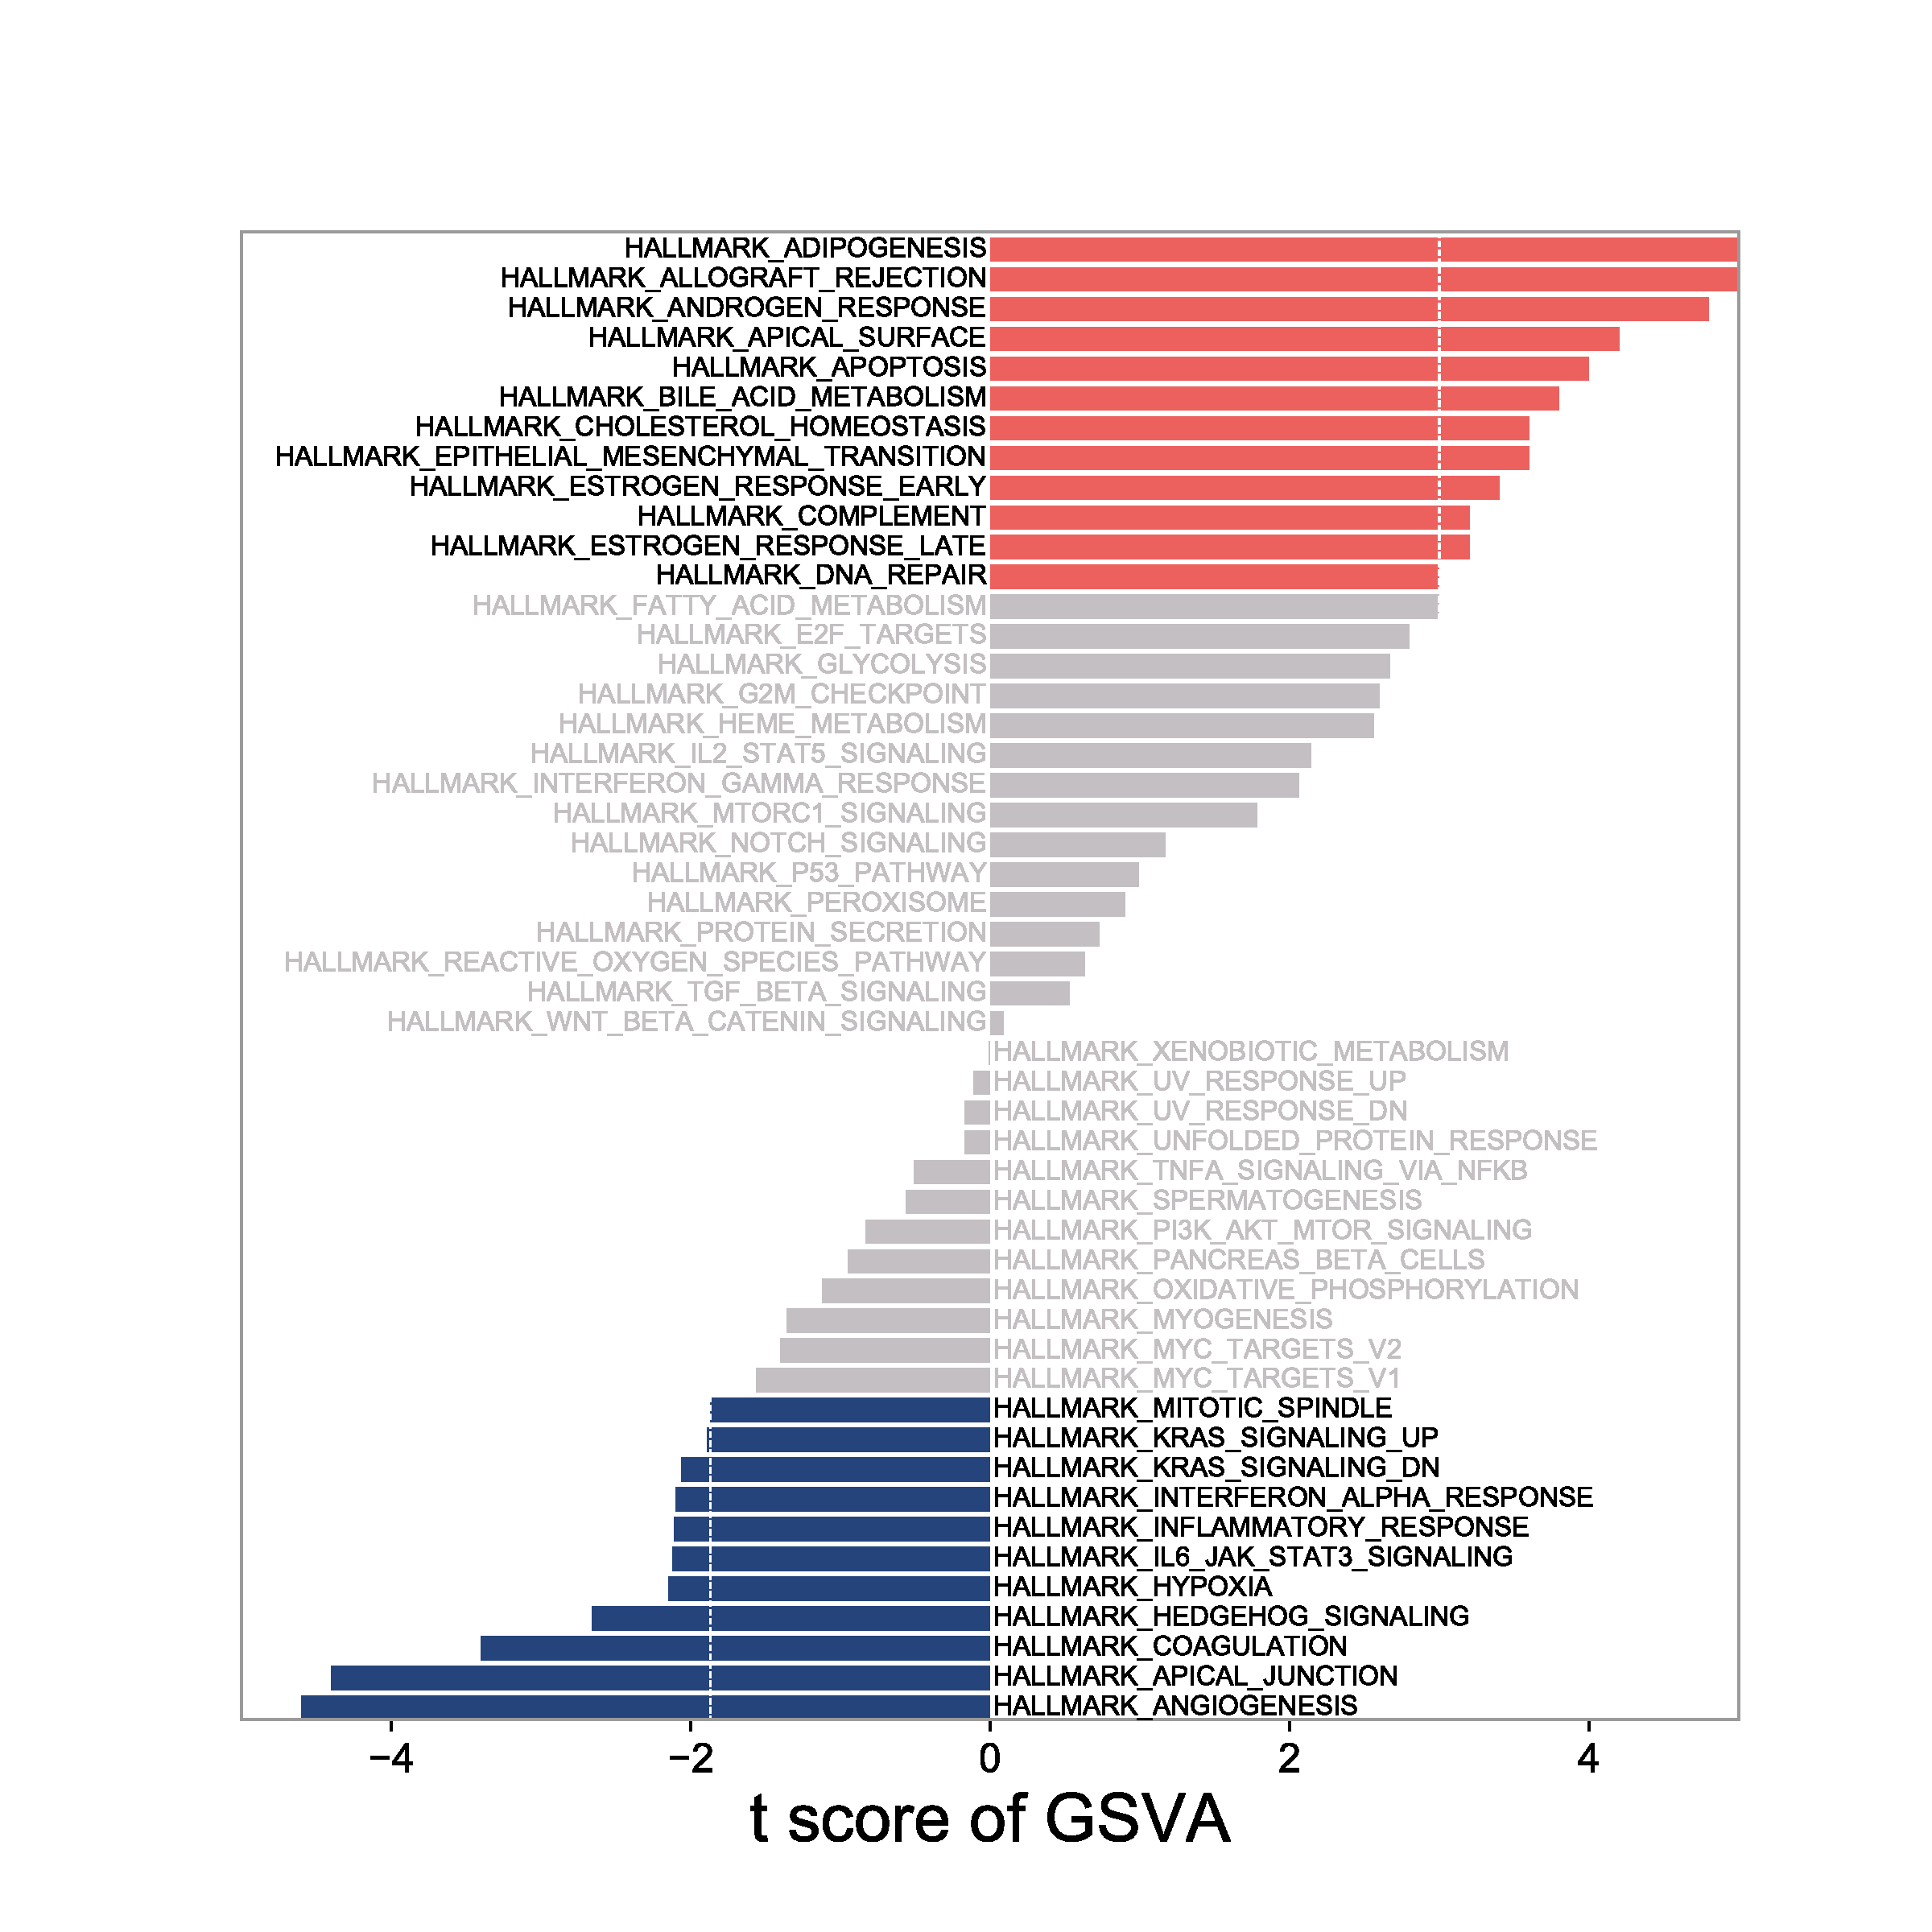
该图用于展示具有正负双向结果,可用于GSEA,GSVA分析结果的展示。
数据说明
数据包含3列。第一列为term名,第二列为富集值(GSEA的nes或者gsva的t等),第三列为显著性p值。右侧数据第二列为正,从大到小排列;左侧第二列为负,从大到小排列。默认垂直线阈值0.05。
论文例子
LncRNA FOXP4-AS1 Promotes Progression of Ewing Sarcoma and Is Associated With Immune Infiltrates. Fig5 AB
如何引用?
建议直接写网址。助力10000+篇
(google学术),9000+篇
(知网)论文
正式引用:Tang D, Chen M, Huang X, Zhang G, Zeng L, Zhang G, Wu S, Wang Y.
SRplot: A free online platform for data visualization and graphing. PLoS One. 2023 Nov 9;18(11):e0294236. doi: 10.1371/journal.pone.0294236. PMID: 37943830.
方法章节:Heatmap was plotted by https://www.bioinformatics.com.cn (last accessed on May 4, 2026), an online platform for data analysis and visualization.
致谢章节:We thank Mingjie Chen (Shanghai NewCore Biotechnology Co., Ltd.) for providing data analysis and visualization support.