花瓣图(flower plot)
简介
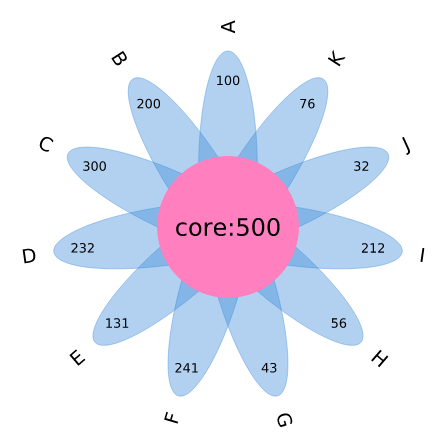
以花瓣形式展示多个样品间的重叠情况。
数据说明
数据为两行,第一行是样品,第二行是数值
论文例子
Comparative genomics of the core and accessory genomes of 48 Sinorhizobium strains comprising five genospecies Fig 3C.
|
输入
|
sample	A	B	C	D	E	F	G	H	I
value	100	200	300	232	131	241	43	56	212
|
| 输出 |
|
如何引用?
建议直接写网址。助力10000+篇
(google学术),9500+篇
(知网)论文
正式引用:Tang D, Chen M, Huang X, Zhang G, Zeng L, Zhang G, Wu S, Wang Y.
SRplot: A free online platform for data visualization and graphing. PLoS One. 2023 Nov 9;18(11):e0294236. doi: 10.1371/journal.pone.0294236. PMID: 37943830.
方法章节:Heatmap was plotted by https://www.bioinformatics.com.cn (last accessed on May 4, 2026), an online platform for data analysis and visualization.
致谢章节:We thank Mingjie Chen (Shanghai NewCore Biotechnology Co., Ltd.) for providing data analysis and visualization support.
