相关系数图
简介
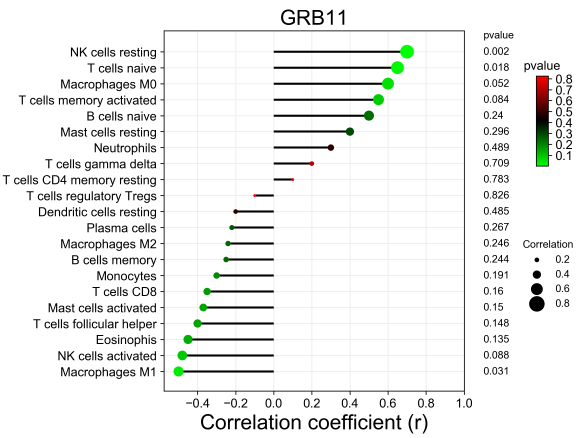
以棒棒糖的形式展示相关性。点的大小代表相关性的绝对值,左侧为负相关,右侧为正相关。颜色表示P值,越红,p值越大。
数据说明
输入为3列:第1列名字,第2列相关系数,第3列p值。
论文例子
Identification and Analysis of Necroptosis-Related Genes in COPD by Bioinformatics and Experimental Verification. fig6
论文写作
Correlations between hub genes and infiltrating immune cells. The size of the dot indicates the strength of the association between the gene and the immune cell type; a larger dot indicates a stronger correlation. The dot’s color represents the p-value; the more purple the color is, the smaller the p-value.
如何引用?
建议直接写网址。助力10000+篇
(google学术),9000+篇
(知网)论文
正式引用:Tang D, Chen M, Huang X, Zhang G, Zeng L, Zhang G, Wu S, Wang Y.
SRplot: A free online platform for data visualization and graphing. PLoS One. 2023 Nov 9;18(11):e0294236. doi: 10.1371/journal.pone.0294236. PMID: 37943830.
方法章节:Heatmap was plotted by https://www.bioinformatics.com.cn (last accessed on May 4, 2026), an online platform for data analysis and visualization.
致谢章节:We thank Mingjie Chen (Shanghai NewCore Biotechnology Co., Ltd.) for providing data analysis and visualization support.