用前必读
1,使用输入检查工具(windows版)检查输入数据
2,使用excel存储并调整数据(wps不行),然后拷贝、粘贴到输入框
3,请勿使用特殊符号,例如#,<,>,%,(,),非英文字符等。默认仅支持英文字符(部分模块除外)
4,使用SVG编辑器或AI,inkscape修改文字、字体,图例,处理截断等,参考inkscape实操
5,生信分析项目合作请加管理员微信(页面右下)

人工客服  基因名转换  FC,P转换  常用配色  影响因子 新需求及bug提交  pdf转图片

必需输入
绘图数据:


可选输入:
图像大小
图片宽:;图片高:

字体、位置、角度
行(基因)字体大小:
列(样品)字体大小:
起始角度:
gap角度:
样品名位置X:
样品名位置Y:

颜色
低颜色:
中间颜色:
高颜色:

聚类方法


距离方法


字体


环形聚类图使用

环形聚类图

简介:
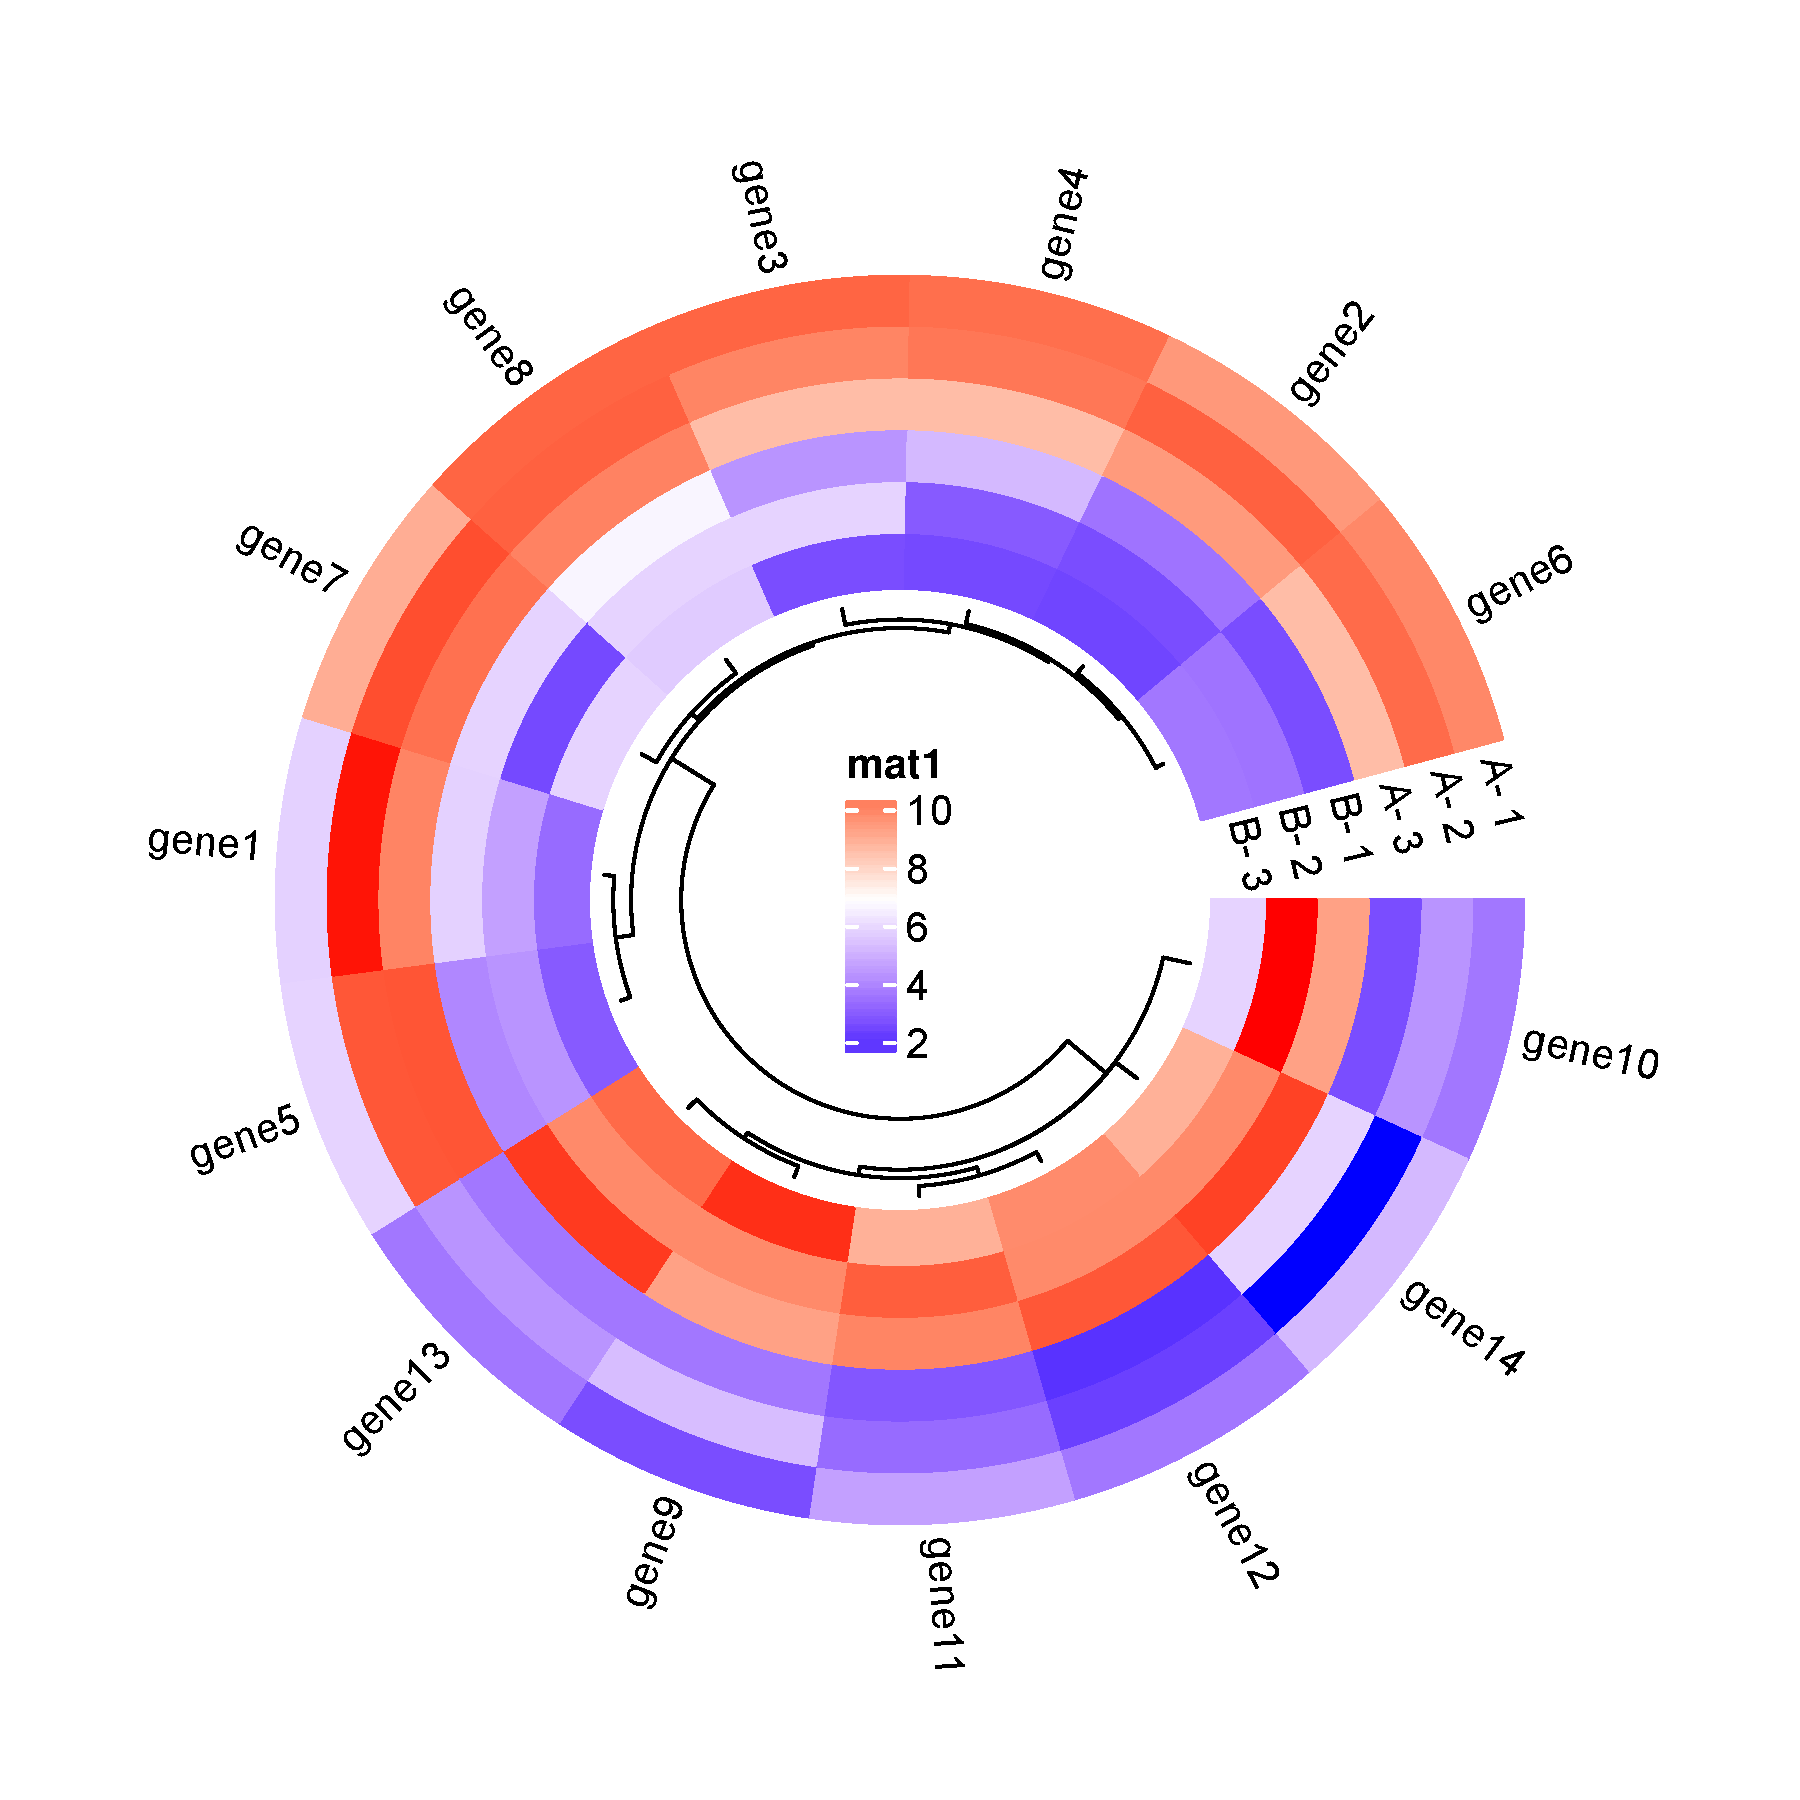
利用颜色表示表达值(原始或标准化),并使用距离矩阵进行聚类。此图调用circlize包(Gu, Z. circlize implements and enhances circular visualization in R)绘图。默认仅对行进行聚类,没有scale。
数据说明:
数据为矩阵形式。第一行为样品名,每列一个样品,其余行为数据行(例如基因表达值)。
生物医学常见应用:
基因表达聚类图。例子:Gu, Z. circlize implements and enhances circular visualization in R Fig 1.
输入
sample	A-1	A-2	A-3	B-1	B-2	B-3
gene1	5.70	11.70	9.90	5.70	4.50	3.20
gene2	9.43	10.67	9.39	3.40	2.50	2.30
gene3	10.59	9.89	8.50	4.20	5.75	2.50
gene4	10.38	10.20	8.50	5.10	2.80	2.40
gene5	5.75	10.85	10.90	3.90	4.20	2.80
gene6	9.82	10.45	8.50	2.50	3.40	3.50
gene7	8.90	11.02	10.33	5.75	2.40	5.75
gene8	10.59	10.67	9.94	6.55	5.75	5.55
gene9	2.50	5.20	3.50	9.21	9.76	11.47
gene10	3.50	4.20	2.50	9.21	11.78	5.75
gene11	4.50	3.20	2.70	9.89	10.72	8.81
gene12	3.50	2.20	1.90	10.85	9.76	9.73
gene13	3.50	4.20	3.50	11.33	9.76	10.49
gene14	5.10	1.20	5.75	11.22	9.76	8.81
输出

1)如何作图?
1,准备作图数据;2,用excel打开数据,调整为示例格式;3,将调整后的数据粘贴到输入框;4,选择参数;5,提交出图
2)为什么不出图?
对输入数据格式有严格要求。请观看输入框上面的视频介绍,并仔细阅读右侧说明,示例数据。
3)如何引用?
3000+篇google学术,2400+篇知网学术引用
推荐直接写网址
Cite: Tang D, Chen M, Huang X, Zhang G, Zeng L, Zhang G, Wu S, Wang Y. SRplot: A free online platform for data visualization and graphing. PLoS One. 2023 Nov 9;18(11):e0294236. doi: 10.1371/journal.pone.0294236. PMID: 37943830.
Method: Heatmap was plotted by https://www.bioinformatics.com.cn (last accessed on 20 Feb 2024), an online platform for data analysis and visualization.
Acknowledgement: We thank Shanghai NewCore Biotechnology Co., Ltd. (https://www.bioinformatics.com.cn, last accessed on 20 Feb 2024) for providing data analysis and visualization support.
4)交流群/公众号