中国地图(疫情图)
简介
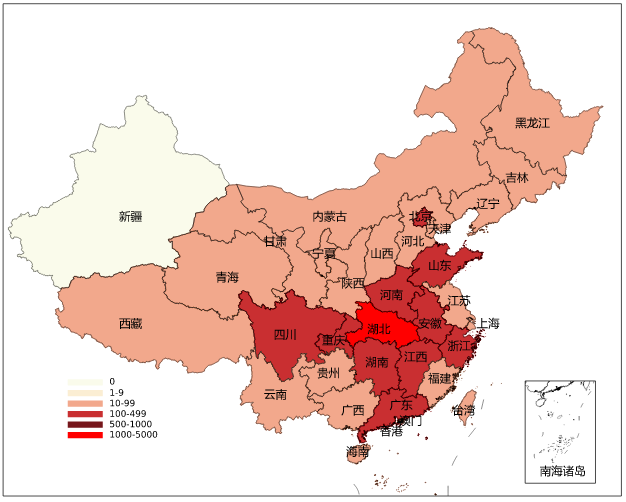
以不同颜色展示不同省的值,可以用来绘制所有与数值相关的数据(例如GDP,疫情图,人口等)。
数据说明
两列,第一列是省份(为避免书写不一致,例如有人写”北京“,有人写”北京市“,所有名字均固定,不能改,否则比较乱),第二列是确诊数(数据仅供测试)
注意:地图边界数据来自https://github.com/dongli/china-shapefiles,仅供交流学习使用!省级地图已经上线20个,其他省份陆续上线中。
地级市或者其他区域定制
论文例子
面向COVID-19传播模式的多因素影响分析 Fig2
如何引用?
建议直接写网址。助力10000+篇
(google学术),9000+篇
(知网)论文
正式引用:Tang D, Chen M, Huang X, Zhang G, Zeng L, Zhang G, Wu S, Wang Y.
SRplot: A free online platform for data visualization and graphing. PLoS One. 2023 Nov 9;18(11):e0294236. doi: 10.1371/journal.pone.0294236. PMID: 37943830.
方法章节:Heatmap was plotted by https://www.bioinformatics.com.cn (last accessed on May 4, 2026), an online platform for data analysis and visualization.
致谢章节:We thank Mingjie Chen (Shanghai NewCore Biotechnology Co., Ltd.) for providing data analysis and visualization support.