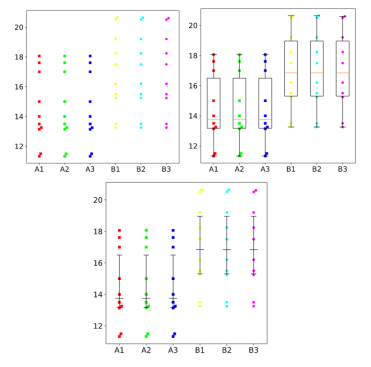
基因表达beewarm(+box图,+3分位图)
数据包括N列表达值,带title
注意:数据格式要自己处理好,
制表符分隔,可以在excel中做好,然后贴过来。保存后修改编辑见下
|
输入
|
genes	A1	A2	A3	B1	B2	B3
gene1	11.33	11.33	11.33	13.25	13.25	13.25
gene2	11.5	11.5	11.5	13.5	13.5	13.5
gene3	13.14	13.14	13.14	15.24	15.24	15.24
gene4	13.15	13.25	13.25	13.14	13.14	15.24
gene5	13.16	13.14	13.5	13.15	13.25	13.14
gene6	14	13.15	13.14	13.16	15.5	15.5
gene7	15	13.16	13.15	18.24	18.24	18.24
gene8	17	17	13.16	19.2	19.2	19.2
gene9	17.61	17.61	17.61	20.5	20.5	20.5
gene10	18.06	18.06	18.06	20.64	20.64	20.64
|
| 输出 |
|
如何引用?
建议直接写网址。助力10000+篇
(google学术),9500+篇
(知网)论文
正式引用:Tang D, Chen M, Huang X, Zhang G, Zeng L, Zhang G, Wu S, Wang Y.
SRplot: A free online platform for data visualization and graphing. PLoS One. 2023 Nov 9;18(11):e0294236. doi: 10.1371/journal.pone.0294236. PMID: 37943830.
方法章节:Heatmap was plotted by https://www.bioinformatics.com.cn (last accessed on May 4, 2026), an online platform for data analysis and visualization.
致谢章节:We thank Mingjie Chen (Shanghai NewCore Biotechnology Co., Ltd.) for providing data analysis and visualization support.
