三维散点图(3D scatter plot)
简介
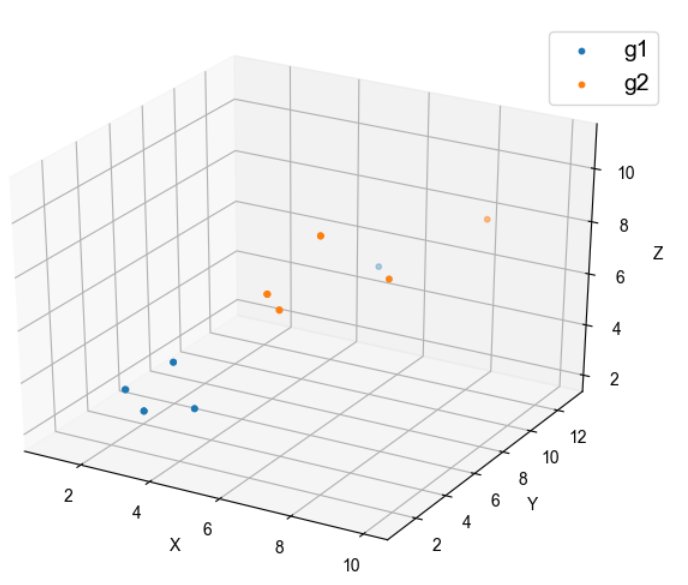
在三维空间中以不同颜色点显示分组数据。
数据说明
数据为矩阵形式。第一列为名字,第2,3,4列为X、Y、Z的数据,第5列为分组(若无分组,本列写g1)
论文例子
Complementary classification of hypertrophic cardiomyopathy using unsupervised cluster analysis on left ventricular function Fig 1
| 输入 |
sample	X	Y	Z	g
s1	1	5	2	g1
s2	2	6	3	g1
s3	3	2	3	g1
s4	4	3	3	g1
s5	5	13	5	g1
s6	6	4	7	g2
s7	7	1	9	g2
s8	8	2	11	g2
s9	9	4	9	g2
s10 10 8 10 g2 |
| 输出 |
|
如何引用?
建议直接写网址。助力10000+篇
(google学术),9000+篇
(知网)论文
正式引用:Tang D, Chen M, Huang X, Zhang G, Zeng L, Zhang G, Wu S, Wang Y.
SRplot: A free online platform for data visualization and graphing. PLoS One. 2023 Nov 9;18(11):e0294236. doi: 10.1371/journal.pone.0294236. PMID: 37943830.
方法章节:Heatmap was plotted by https://www.bioinformatics.com.cn (last accessed on May 4, 2026), an online platform for data analysis and visualization.
致谢章节:We thank Mingjie Chen (Shanghai NewCore Biotechnology Co., Ltd.) for providing data analysis and visualization support.
