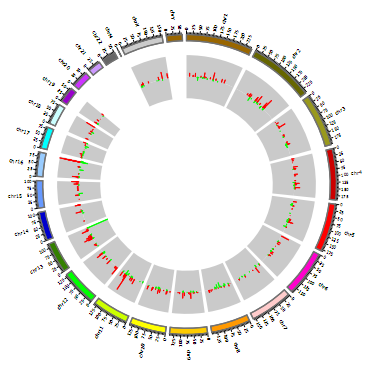
两个tracks的circos柱状图
简介
circos为高通量测序文章中最常见的一类图。
数据说明
数据包括4列,第一列是染色体,第二列是起始坐标,第三列是终止坐标,第四列是数值(例如倍数变化等)
论文例子
Construction of circ_0071922-miR-15a-5p-mRNA network in intervertebral disc degeneration by RNA-sequencing. Fig 1F
如何引用?
建议直接写网址。助力10000+篇
(google学术),9500+篇
(知网)论文
正式引用:Tang D, Chen M, Huang X, Zhang G, Zeng L, Zhang G, Wu S, Wang Y.
SRplot: A free online platform for data visualization and graphing. PLoS One. 2023 Nov 9;18(11):e0294236. doi: 10.1371/journal.pone.0294236. PMID: 37943830.
方法章节:Heatmap was plotted by https://www.bioinformatics.com.cn (last accessed on May 4, 2026), an online platform for data analysis and visualization.
致谢章节:We thank Mingjie Chen (Shanghai NewCore Biotechnology Co., Ltd.) for providing data analysis and visualization support.