不带着丝粒的基因组位点染色体分布图
简介
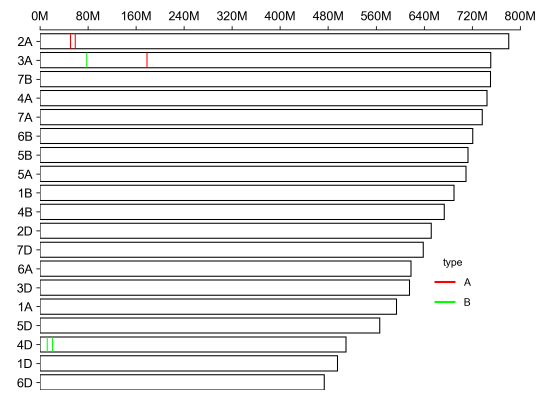
该图一般用来表示peak,SNP,基因等在染色体上的全局分布。
数据说明
染色体长度数据包括两列:第一列为染色体名字,第二列为染色体长度
基因组位点数据包括3列(第3列可选):第一列是染色体名字(必需与上述染色体长度数据一致);第二列为位点;第三列为类型(例如up,dn等,可选,最多6种可选颜色)。
论文例子
| 染色体长度输入 |
2A	780798557
3A	750843639
7B	750620385
4A	744588157
7A	736706236
6B	720988478
5B	713149757
5A	709773743
1B	689851870
4B	673617499
2D	651852609
7D	638686055
6A	618079260
3D	615552423
1A	594102056
5D	566080677
4D	509857067
1D	495453186
6D 473592718 |
| 基因组位点输入 |
chrom	pos	type
2A	50602155	A
2A	58861277	A
3A	178099541	A
3A	77794217	B
4D	20732565	B
4D 11935999 B |
| 输出 |
|
如何引用?
建议直接写网址。3600+篇
google学术,3000+篇
知网学术
正式引用:Tang D, Chen M, Huang X, Zhang G, Zeng L, Zhang G, Wu S, Wang Y.
SRplot: A free online platform for data visualization and graphing. PLoS One. 2023 Nov 9;18(11):e0294236. doi: 10.1371/journal.pone.0294236. PMID: 37943830.
方法章节:Heatmap was plotted by https://www.bioinformatics.com.cn (last accessed on 20 June 2024), an online platform for data analysis and visualization.
致谢章节:We thank Mingjie Chen (Shanghai NewCore Biotechnology Co., Ltd.) for providing data analysis and visualization support.
