GO chord
Introduction
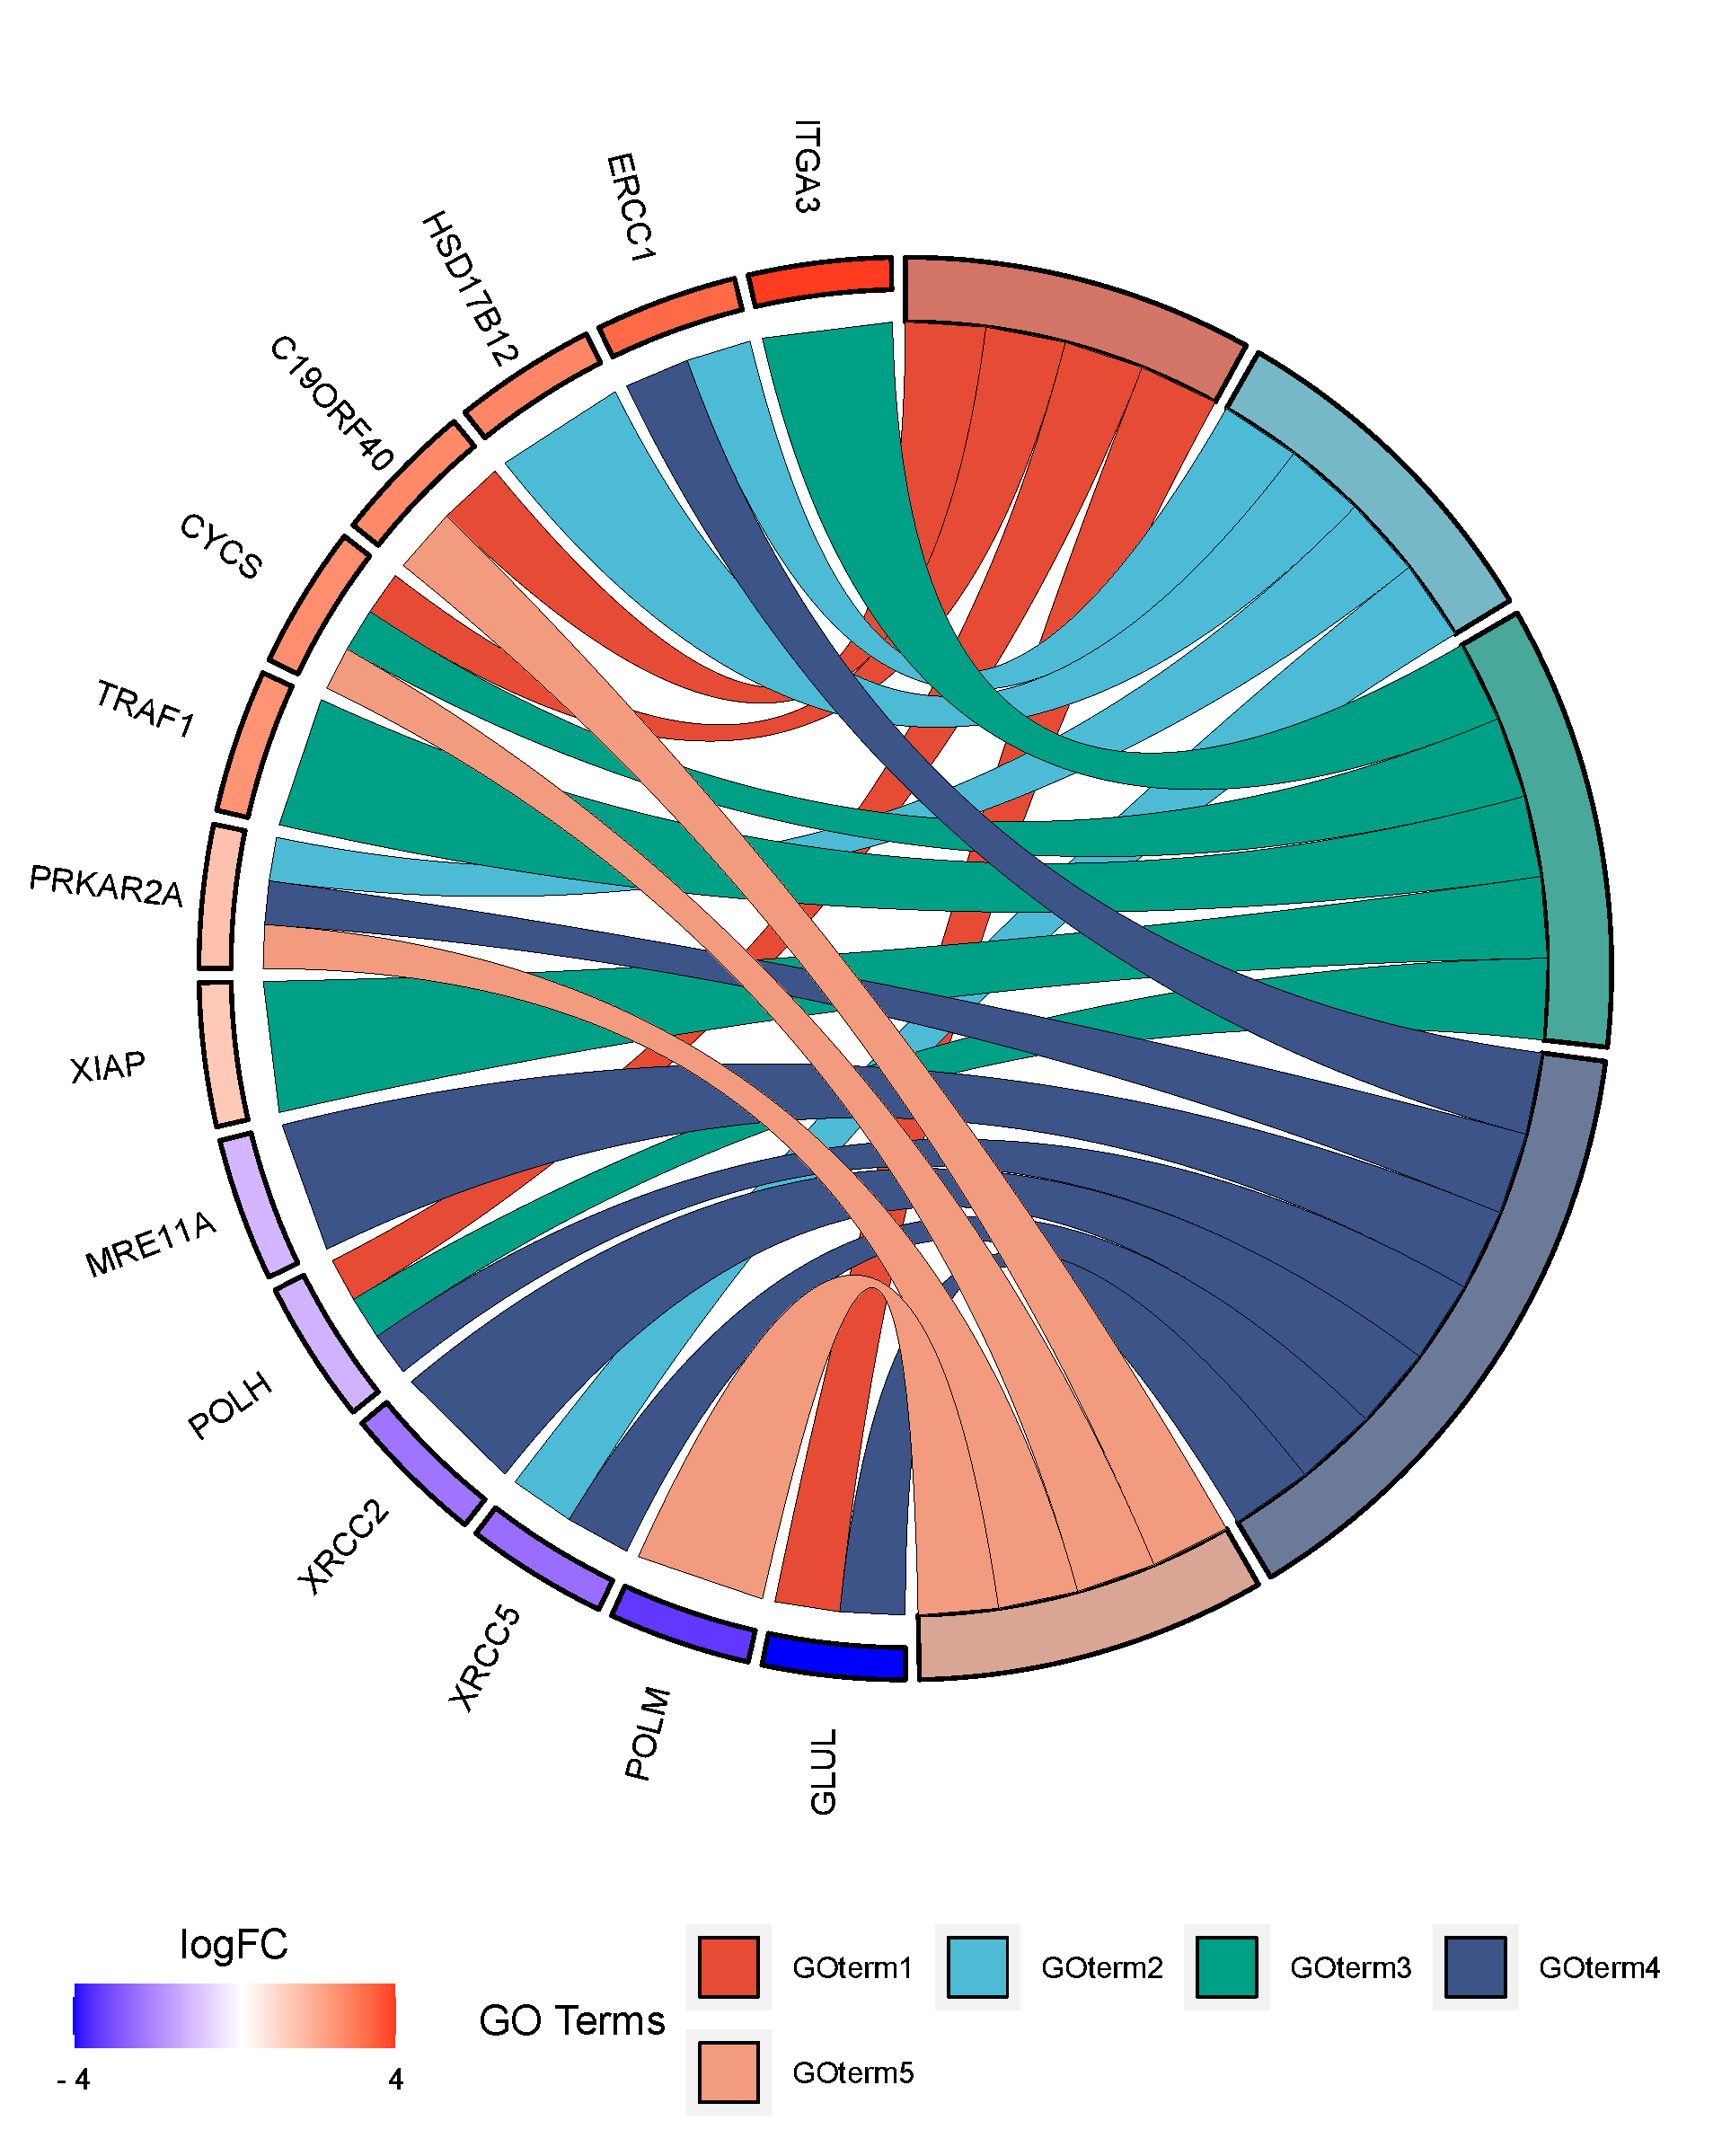
Using chord plot to show the relationship bewteen GO term and genes. Please use
GO analysis or
metascape to perform GO enrichment analysis, and then plot. Reference: GOplot R packages.
Using
Format conversion or converting by yourself.
Input data instructions
Input data contain three part, the first part (column 1) is gene, and the third part (last column) is logFC (used for ordering genes and displaying different colors. If you do not have logFC column, all genes will be displayed with grey colors.
The other part is GO terms, 1 means gene is in GO term, 0 means gene is not in GO term. Generally, data with 20-30 genes, 6-8 GO terms are better. Plot at most 30 terms.
Note:
1. Can also used for other simililar belonging relationships, such as KEGG Pathway.
2. If term is long, please use
inkscape to edit the svg output figure.
3. Change width or height if the circle is not a perfect circle.
Paper example
An intersectional analysis of LncRNAs and mRNAs reveals the potential therapeutic targets of Bi Zhong Xiao Decoction in collagen-induced arthritis rats
1) How to plot?
1, Put data in excel according to the example format.
2, Copy and paste into input frame.
3, Input pre-checking button to check input
4, After checking pass, select parameters, submit and download
2) How to cite?
9000+ papers in (Google Scholar)
Tang D, Chen M, Huang X, Zhang G, Zeng L, Zhang G, Wu S, Wang Y. SRplot: A free online platform for data visualization and graphing. PLoS One. 2023 Nov 9;18(11):e0294236. doi: 10.1371/journal.pone.0294236. PMID: 37943830.
3) FAQs