pathview KEGG Pathway Map
Introduction
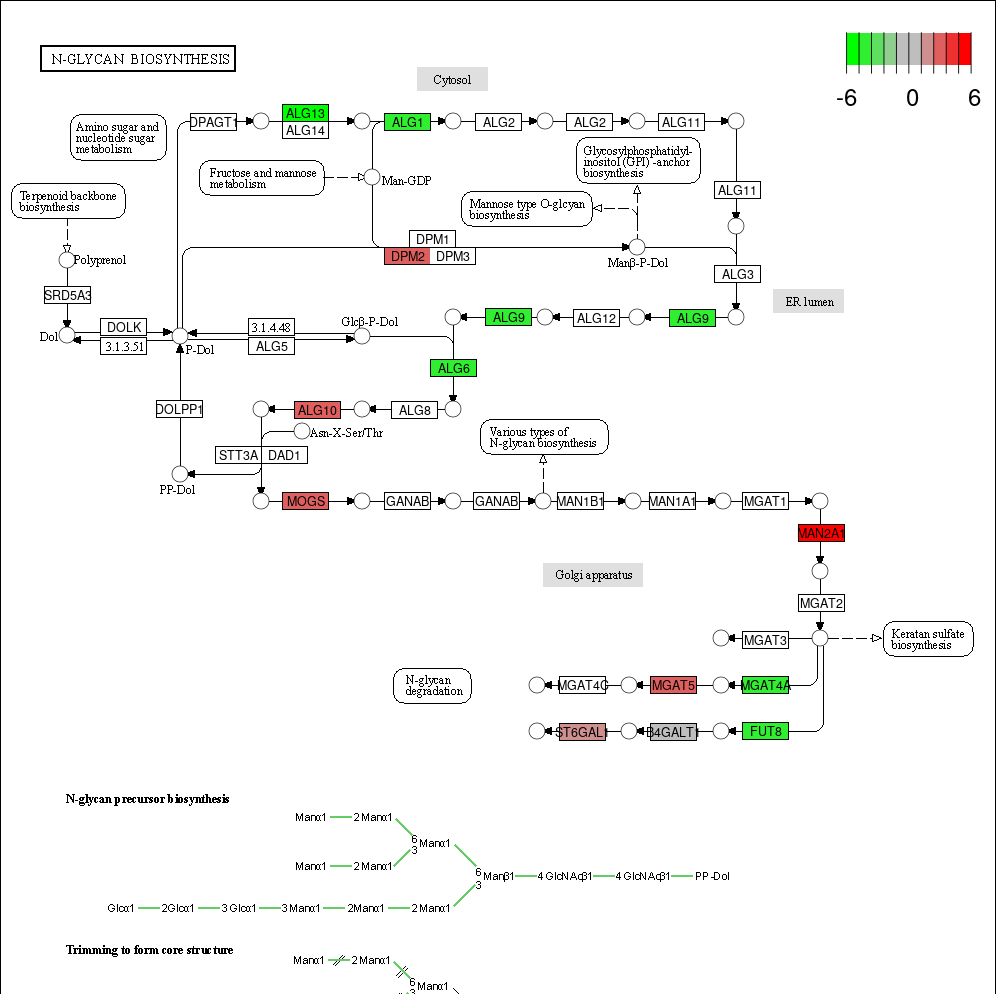
Use Pathview R to render the KEGG Pathway map. Add colors based on the values of genes or compounds. Combine the KEGG map, gene expression, metabolites informations.
The pathview downloads and uses KEGG data. Non-academic uses may require a KEGG license agreement (details at http://www.kegg.jp/kegg/legal.html).
Input data instructions
Input data contains two columns: the first column is gene id or compound id or drug id. gene ids are from the most left ids of Gene part of certain KEGG pathway id page (mostly are entrez geneid),
compound ids are from the most left ids of Compound part (start with C), drug ids are from the most left ids of Drug part (start with D). The second column is values (log2fc, or other meaningful value).
the first cell in column one and row one is KEGG ID, please search at
KEGG official website, for example, the KEGG ID of "NF-kappa B signaling pathway - Homo sapiens (human)" is hsa04064.
More advanced usage, please refer to pathview official website: https://pathview.uncc.edu/
Example
Characterization of Stem-like Circulating Tumor Cells in Pancreatic Cancer Fig 5C.
1) How to plot?
1, Put data in excel according to the example format.
2, Copy and paste into input frame.
3, Input pre-checking button to check input
4, After checking pass, select parameters, submit and download
2) How to cite?
9000+ papers in (Google Scholar)
Tang D, Chen M, Huang X, Zhang G, Zeng L, Zhang G, Wu S, Wang Y. SRplot: A free online platform for data visualization and graphing. PLoS One. 2023 Nov 9;18(11):e0294236. doi: 10.1371/journal.pone.0294236. PMID: 37943830.
3) FAQs