Forest plot
Introduction
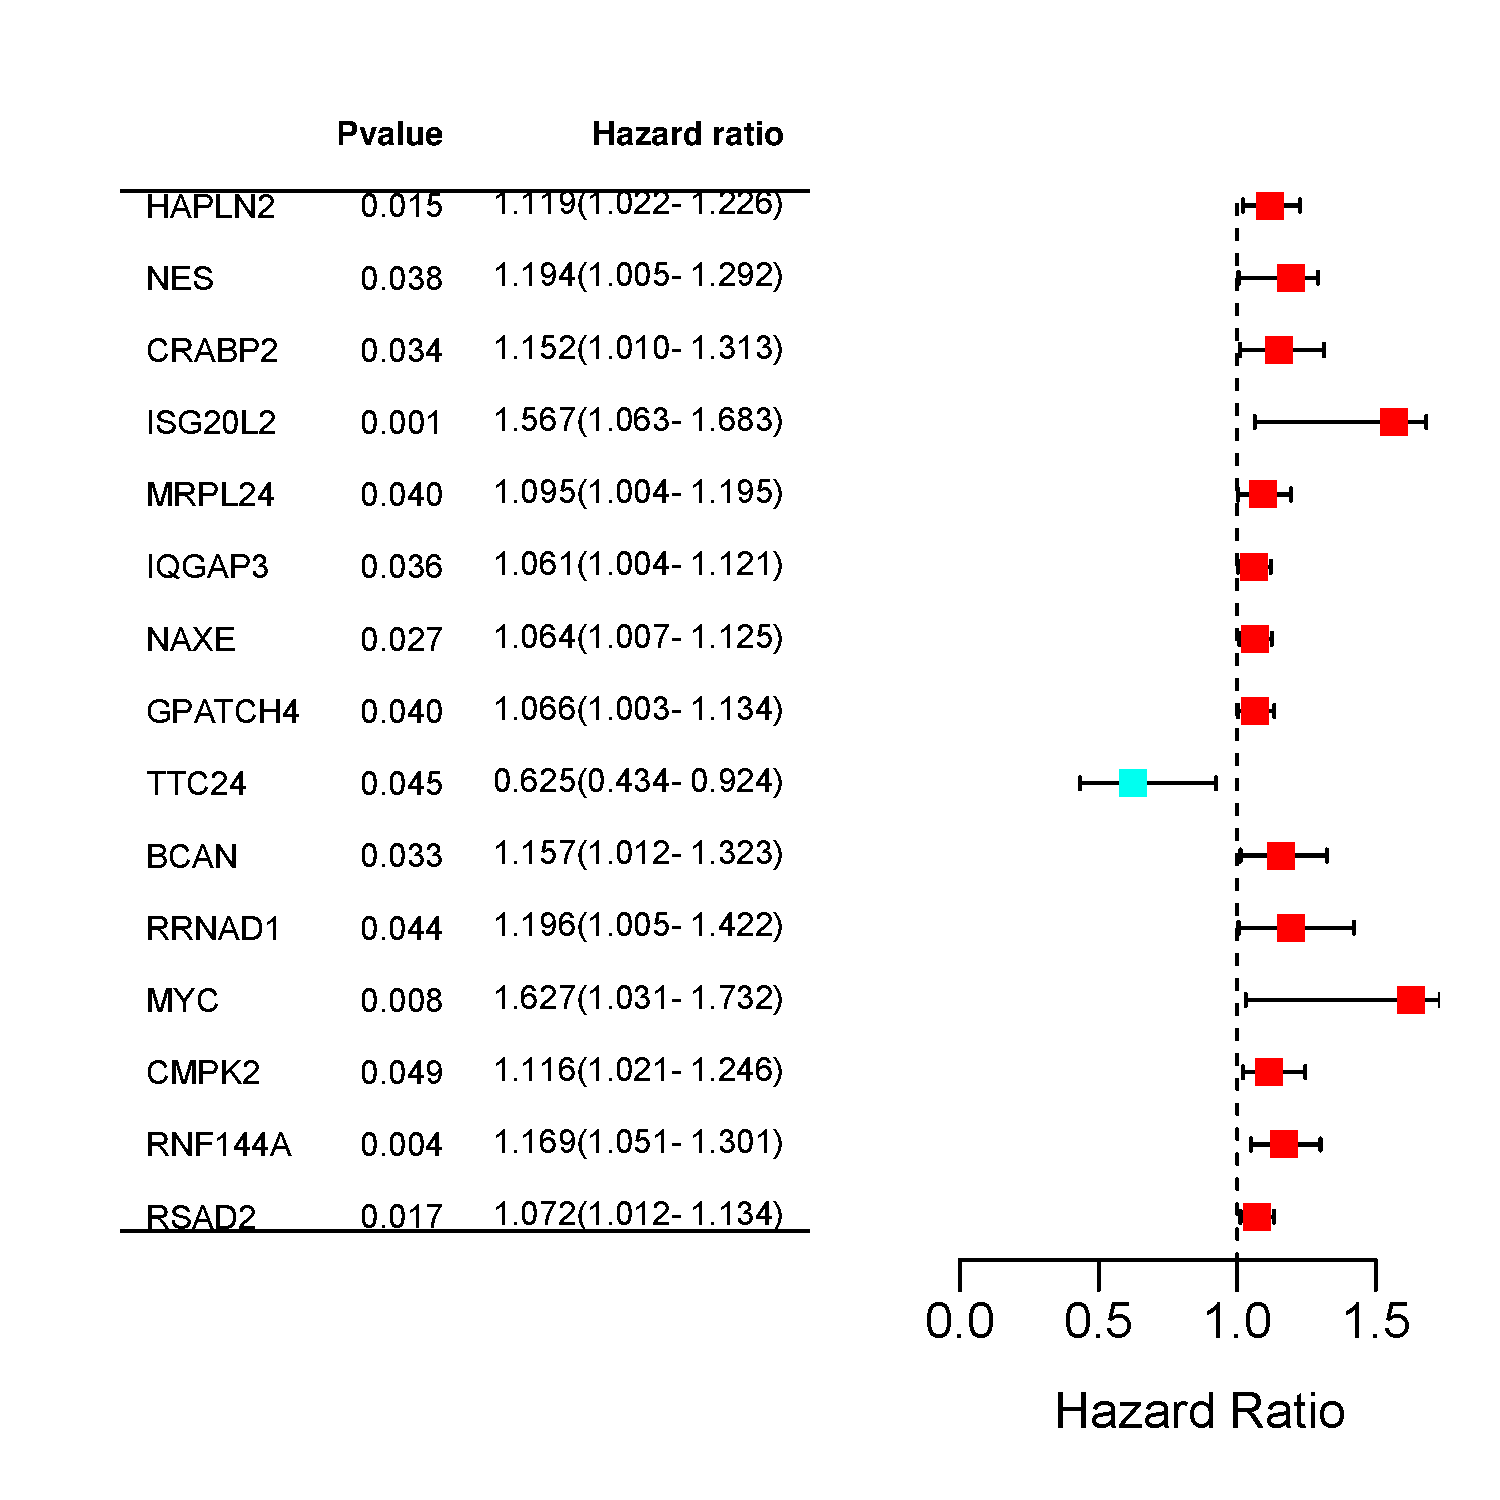
A forest plot is a graphical representation used primarily in meta-analysis to visually display the effect sizes and confidence intervals from multiple studies. When it comes to survival analysis, hazard ratios (HRs) are commonly used to measure the effect of one or more predictor variables on the survival time, particularly in the Cox proportional hazards model.
Each study's hazard ratio is represented by a horizontal line in the forest plot, with the ends of the line indicating the upper and lower bounds of the 95% confidence interval. A square or a diamond usually appears at the center of the line, with its size representing the weight of the study in the analysis. The position of this square or diamond indicates the point estimate of the hazard ratio. If the square or diamond does not cross the line of no effect (often set at 1), it suggests that the observed hazard ratio is statistically significant.
Data instructions
matrix format. 5 columns. The first column is gene or other clinical phenotypes. The second column is HR. The third column is lower 95% HR. The fourth column is higher 95% HR. The last column is p value. note: NO special characters in the first row.
Paper example
A novel ferroptosis-related gene signature for prognostic prediction of patients with lung adenocarcinoma Fig 4A
1) How to plot?
1, Put data in excel according to the example format.
2, Copy and paste into input frame.
3, Input pre-checking button to check input
4, After checking pass, select parameters, submit and download
2) How to cite?
9000+ papers in (Google Scholar)
Tang D, Chen M, Huang X, Zhang G, Zeng L, Zhang G, Wu S, Wang Y. SRplot: A free online platform for data visualization and graphing. PLoS One. 2023 Nov 9;18(11):e0294236. doi: 10.1371/journal.pone.0294236. PMID: 37943830.
3) FAQs