Dumbbell chart
Introduction
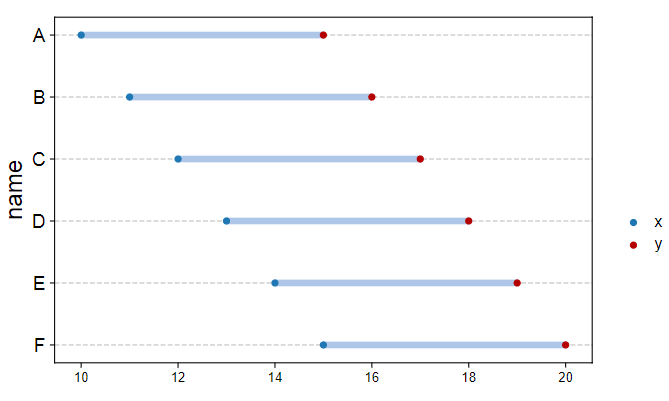
Dumbbell chart is a composite chart with circles and lines. It is ideal for illustrating change and comparing the distance between two groups of data points
Input data instructions
The data consists of three columns, with the first column being the names and the second and third columns being numerical values. Generally, the smaller value is placed in the second column, and the larger value is in the third column. The data can be sorted according to the following criteria: 1) Alphabetical order of the first column; 2) The size of the second column; 3) The size of the third column; 4) The difference between the third and second columns. After sorting, a graph can be made, which not only looks more aesthetically pleasing but can also provide additional insights from the visual representation.
Paper example
SLC26A4 correlates with homologous recombination deficiency and patient prognosis in prostate cancer. fig2e
Paper writing
Dumbbell chart showing the CNV frequency of HRD-related genes. Red dots meant deletion frequency, and blue dots meant amplification frequency.
1) How to plot?
1, Put data in excel according to the example format.
2, Copy and paste into input frame.
3, Input pre-checking button to check input
4, After checking pass, select parameters, submit and download
2) How to cite?
9000+ papers in (Google Scholar)
Tang D, Chen M, Huang X, Zhang G, Zeng L, Zhang G, Wu S, Wang Y. SRplot: A free online platform for data visualization and graphing. PLoS One. 2023 Nov 9;18(11):e0294236. doi: 10.1371/journal.pone.0294236. PMID: 37943830.
3) FAQs