Read before use
1, check data with precheck (windows version) tools
2, data from excel, copy and paste data into the input frame
3, data from txt, must tab-seperated, copy and paste data into the input frame
4, specieal and non-English characters such as #, <, >, %, (, ), α are not friendly
5, use point as decimal separator, not comma. e.g. 3.14, not 3,14 as pi
Required

Optional
left margin:
right margin:
bottom margin:
top margin:
ticks fontsize:
label fontsize:

Y label:
marker size:

Marker shape and colors
marker 1)
square circle triangle inverted triangle plus star color 1:

marker 2)
square circle triangle invered triangle plus star color 2:

marker 3)
square circle triangle inverted triangle plus star color 3:

marker 4)
square circle triangle inverted triangle plus star color 4:

marker 5)
square circle triangle inverted triangle plus star color 5:

marker 6)
square circle triangle inverted triangle plus star color 6:

addtional: box or 王
no box

beewarm (+box, + quantiles)

Introduction
Input data instructions
Matrix input data.
Examples from papers
Input
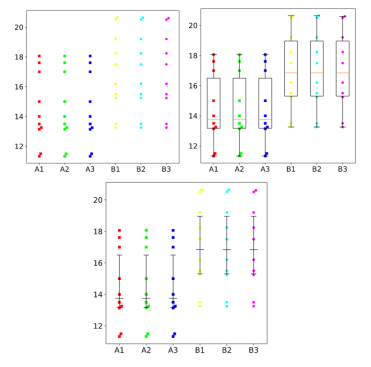
genes	A1	A2	A3	B1	B2	B3
gene1	11.33	11.33	11.33	13.25	13.25	13.25
gene2	11.5	11.5	11.5	13.5	13.5	13.5
gene3	13.14	13.14	13.14	15.24	15.24	15.24
gene4	13.15	13.25	13.25	13.14	13.14	15.24
gene5	13.16	13.14	13.5	13.15	13.25	13.14
gene6	14	13.15	13.14	13.16	15.5	15.5
gene7	15	13.16	13.15	18.24	18.24	18.24
gene8	17	17	13.16	19.2	19.2	19.2
gene9	17.61	17.61	17.61	20.5	20.5	20.5
gene10	18.06	18.06	18.06	20.64	20.64	20.64
Output

1) How to plot?
1, Put data in excel according to the example format.
2, Copy and paste into input frame.
3, Input pre-checking button to check input
4, After checking pass, select parameters, submit and download

2) How to cite?
3000+ papers in (Google Scholar)
Tang D, Chen M, Huang X, Zhang G, Zeng L, Zhang G, Wu S, Wang Y. SRplot: A free online platform for data visualization and graphing. PLoS One. 2023 Nov 9;18(11):e0294236. doi: 10.1371/journal.pone.0294236. PMID: 37943830.

3) FAQs