area stack
Introduction
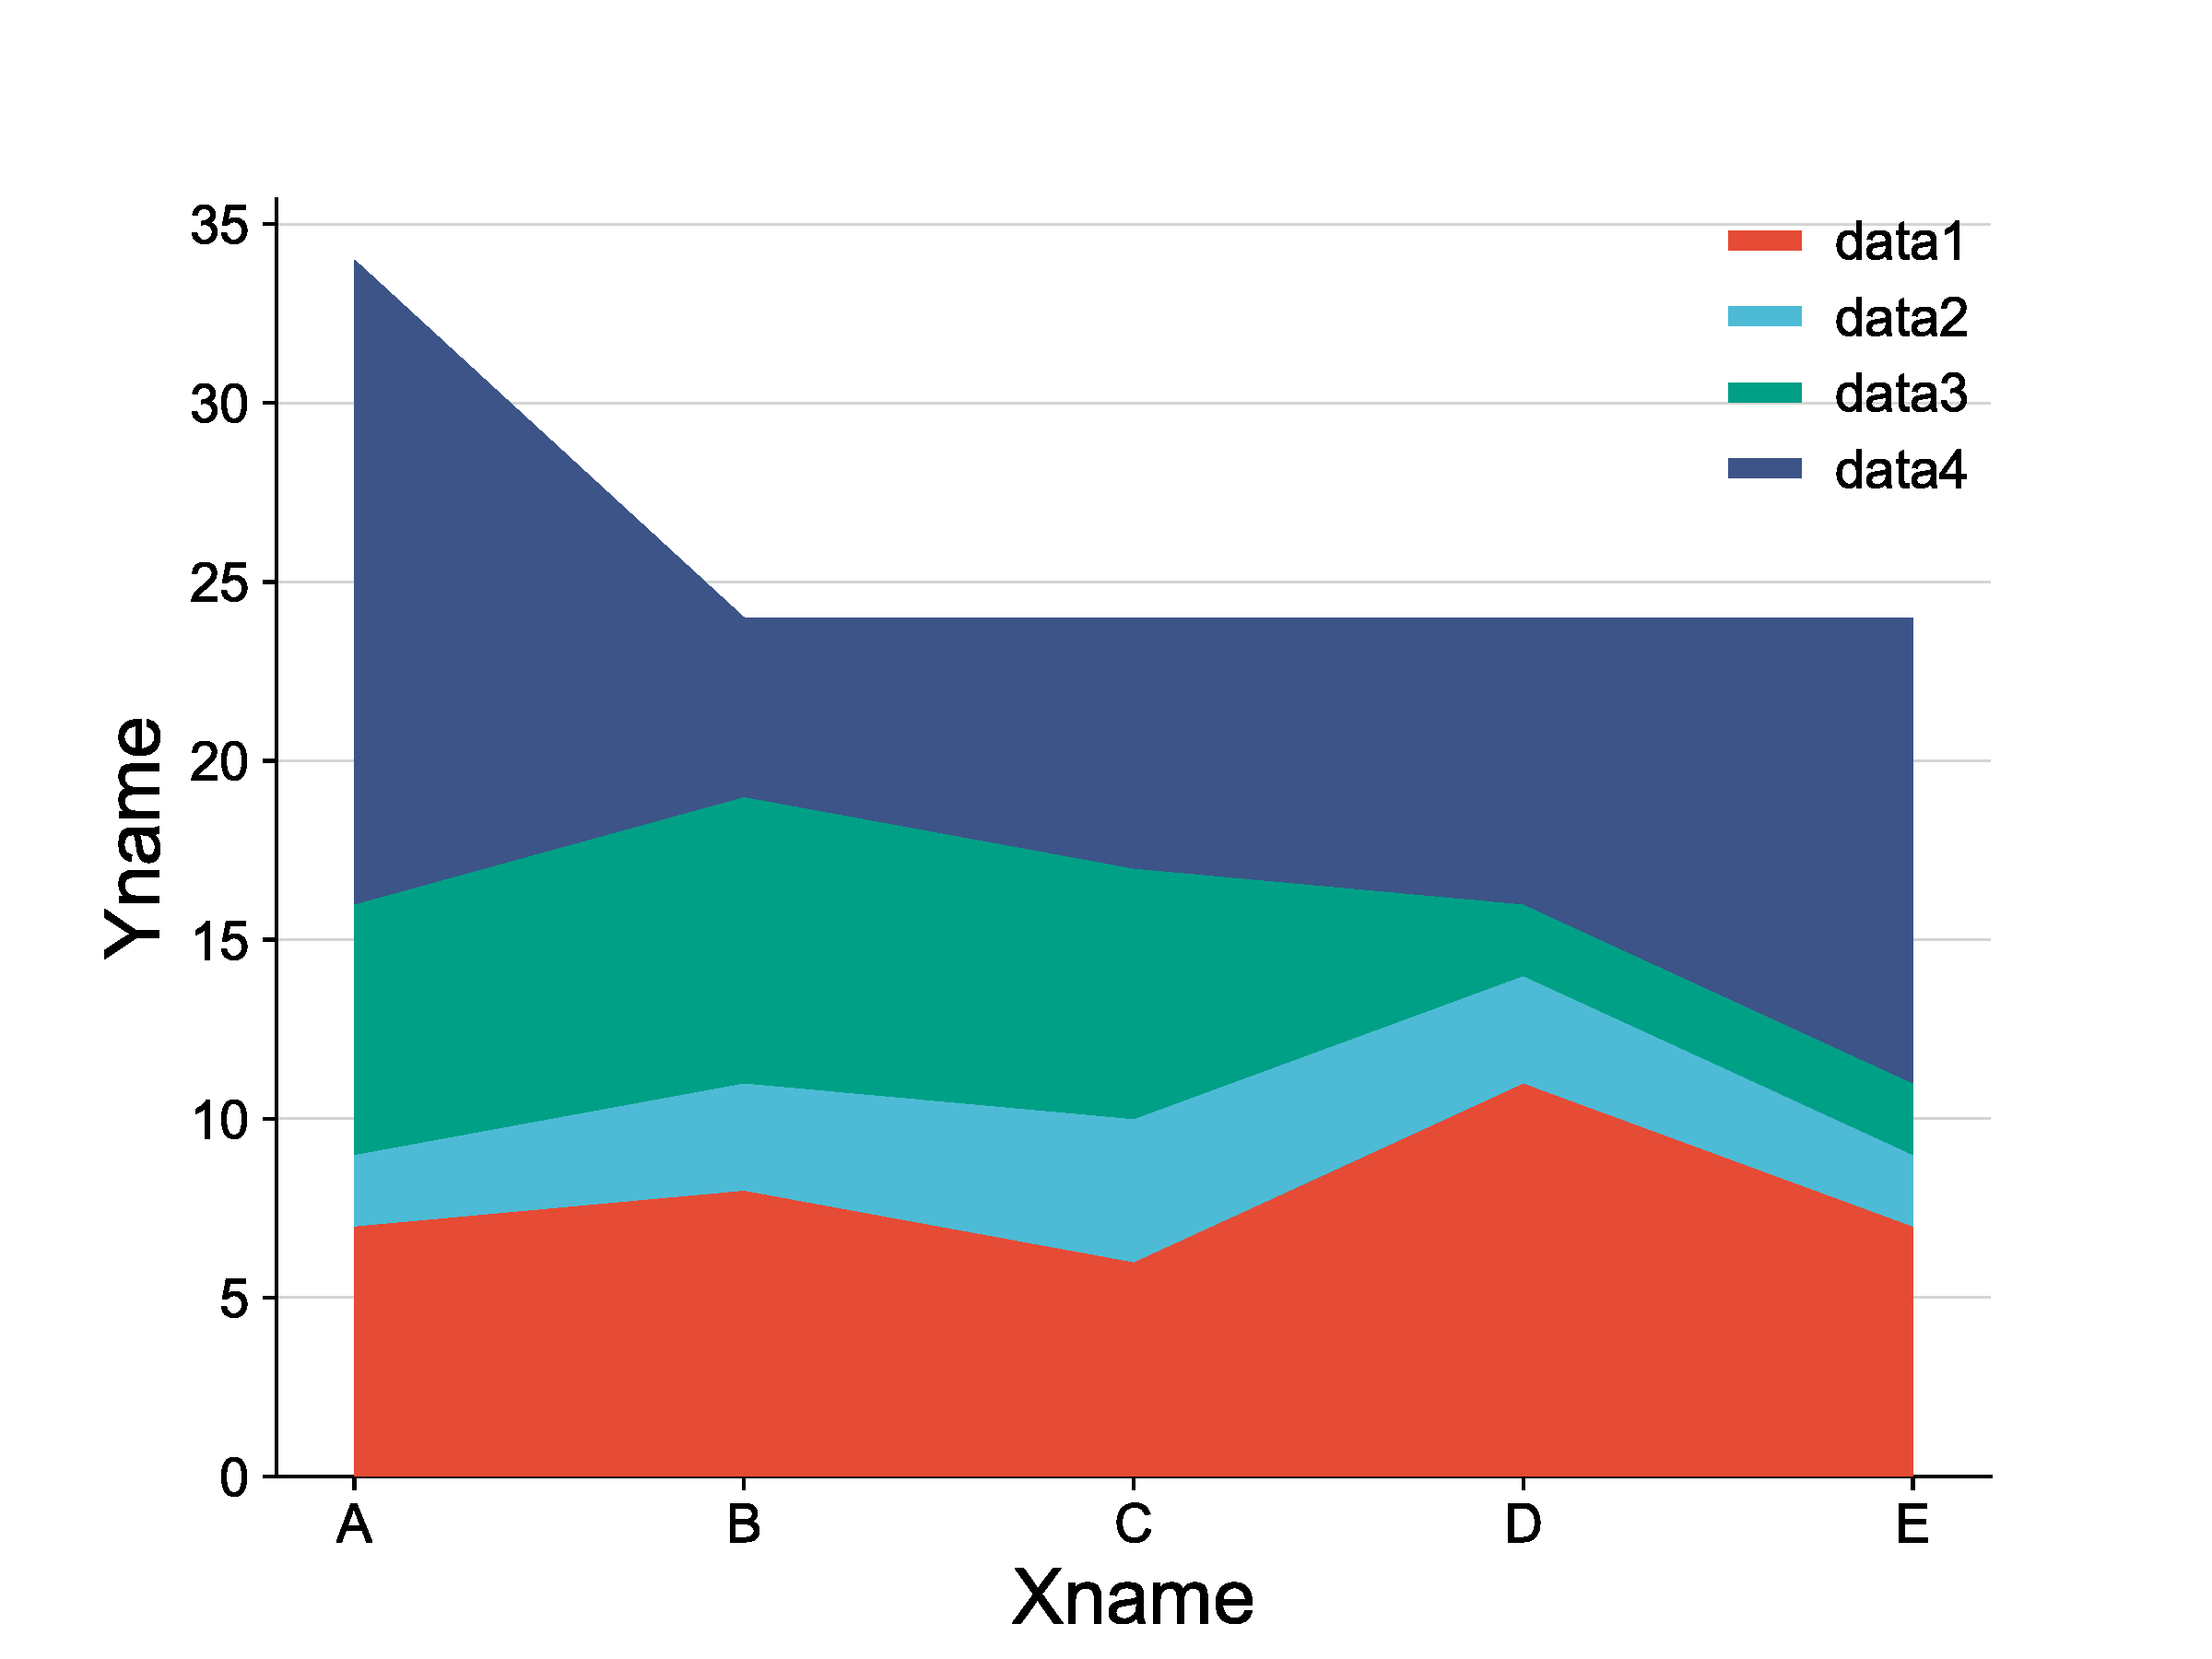
An Area Stack Chart, also known as a Stacked Area Chart, it displays the trend of multiple categories over the same time or space. This chart type stacks the areas of each category on top of each other to show their cumulative effect over time or space.
Key Features:
1) Multi-Dimensional Display: It can display multiple data series simultaneously.
2) Cumulative Effect: The area of each data series is calculated based on the cumulative value of the previous series.
3) Time Series: Typically used to show data that changes over time.
4) Comparison: It allows for a direct comparison of the relative sizes and trends of different categories.
Input data analysis
Input a data matrix. Columns for X axis, Rows for Y axis.
Paper example
Epidemiological features and temporal trends of HIV- negative tuberculosis burden from 1990 to 2019: a retrospective analysis based on the Global Burden of Disease Study 2019 fig 4A
| Input |
xticks	A	B	C	D	E
data1	7	8	6	11	7
data2	2	3	4	3	2
data3	7	8	7	2	2
data4 18 5 7 8 13 |
| Output |
|
1) How to plot?
1, Put data in excel according to the example format.
2, Copy and paste into input frame.
3, Input pre-checking button to check input
4, After checking pass, select parameters, submit and download
2) How to cite?
9000+ papers in (Google Scholar)
Tang D, Chen M, Huang X, Zhang G, Zeng L, Zhang G, Wu S, Wang Y. SRplot: A free online platform for data visualization and graphing. PLoS One. 2023 Nov 9;18(11):e0294236. doi: 10.1371/journal.pone.0294236. PMID: 37943830.
3) FAQs