Vertical lollipop chart
Introduction
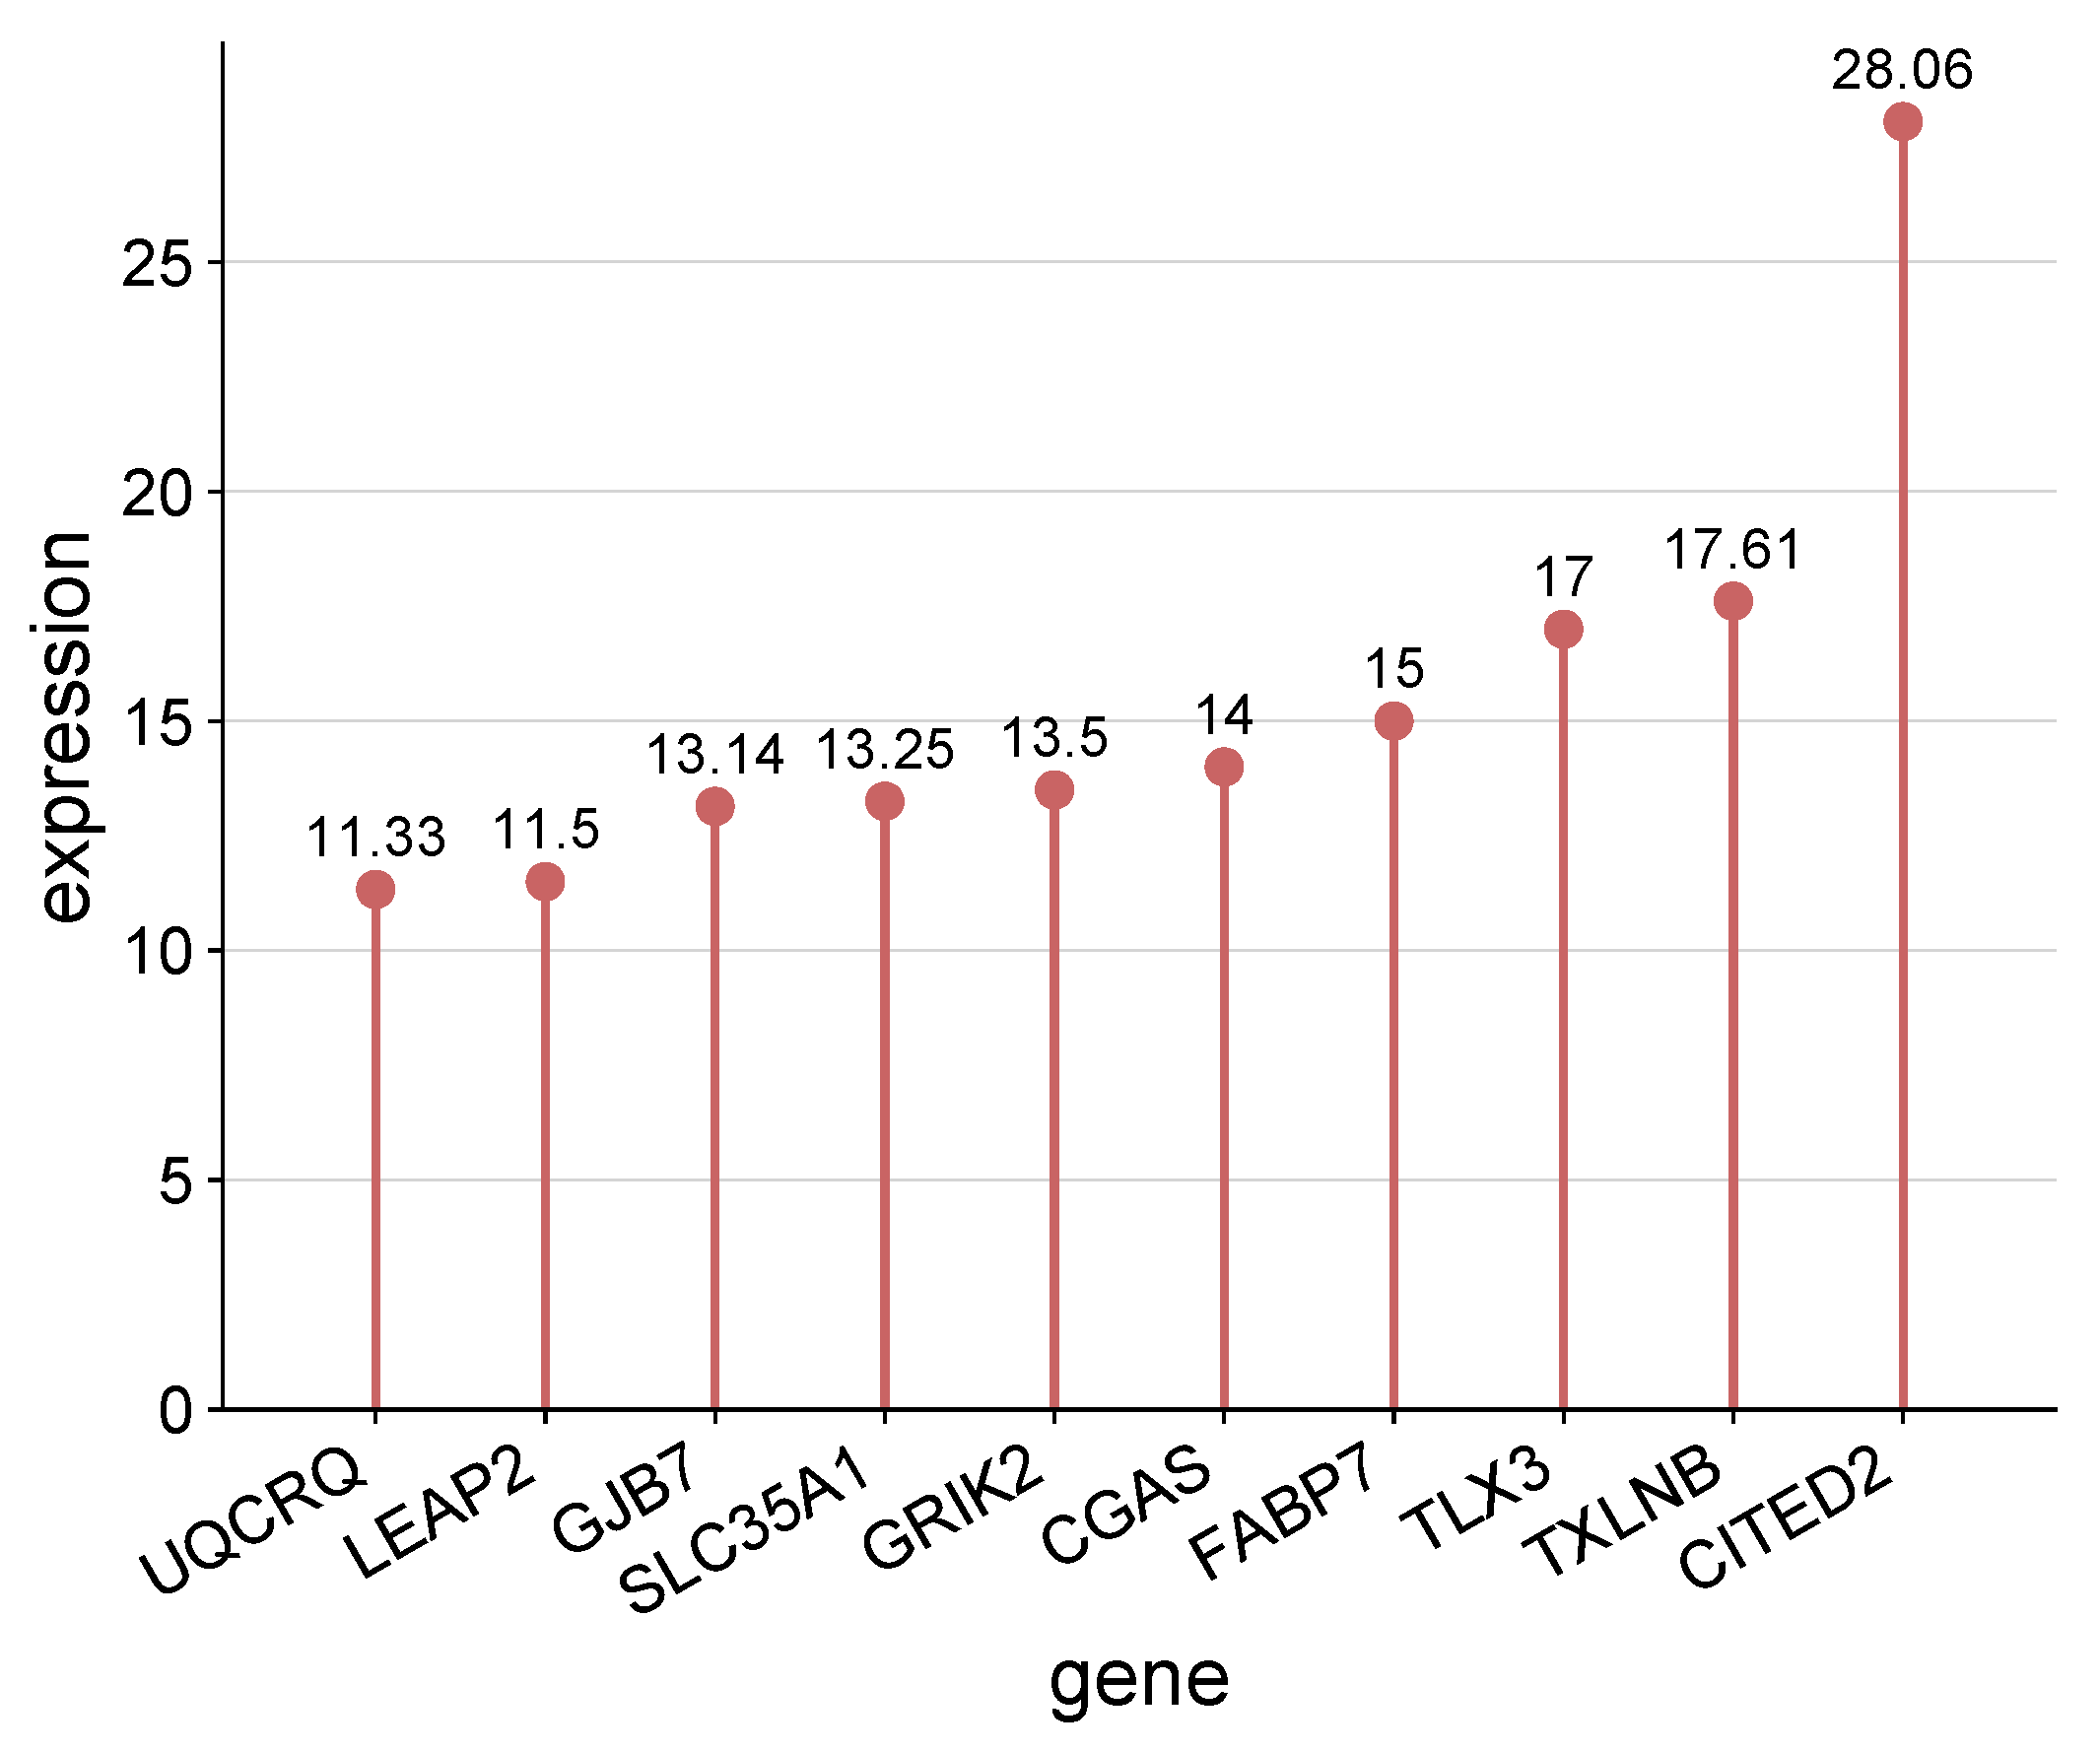
The shape of this plot seems like a lollipop, so name it.
Input data instructions
Input data contain 3 columns: 1, name; 2, corresponding value (height); 3, labelled value (can be the same with column 2).
Input data contain 4 columns: 1, name; 2, corresponding value (height); 3, labelled value (can be the same with column 2); 4, groups (at most 6 groups)
Paper example
Transcriptome, Spliceosome and Editome Expression Patterns of the Porcine Endometrium in Response to a Single Subclinical Dose of Salmonella Enteritidis Lipopolysaccharide. Fig3
Caption
Lollipop chart of the top 10 Gene Ontology (GO) terms for each GO aspect (biological process; cellular components; molecular function), scattered according to -log10 p-value. Numbers in circles refer to the number of DEGs annotated to the specific GO term.
1) How to plot?
1, Put data in excel according to the example format.
2, Copy and paste into input frame.
3, Input pre-checking button to check input
4, After checking pass, select parameters, submit and download
2) How to cite?
9000+ papers in (Google Scholar)
Tang D, Chen M, Huang X, Zhang G, Zeng L, Zhang G, Wu S, Wang Y. SRplot: A free online platform for data visualization and graphing. PLoS One. 2023 Nov 9;18(11):e0294236. doi: 10.1371/journal.pone.0294236. PMID: 37943830.
3) FAQs