test account: test Password: bio123456789
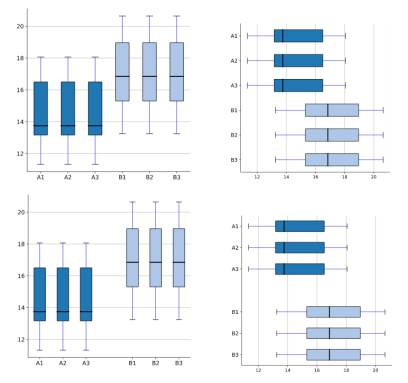
| Input | genes A1 A2 A3 B1 B2 B3 CTNNBL1 11.33 11.33 11.33 13.25 13.25 13.25 LPIN3 11.5 11.5 11.5 13.5 13.5 13.5 ZSWIM3 13.14 13.14 13.14 15.24 15.24 15.24 RBM38 13.25 13.25 13.25 16.2 16.2 16.2 VSTM2L 13.5 13.5 13.5 17.5 17.5 17.5 OSER1 14 14 14 15.5 15.5 15.5 SERINC3 15 15 15 18.24 18.24 18.24 PPP1R3D 17 17 17 19.2 19.2 19.2 DMGDH 17.61 17.61 17.61 20.5 20.5 20.5 BHMT2 18.06 18.06 18.06 20.64 20.64 20.64 |
| Output |
|
1) How to plot?
1, Put data in excel according to the example format.
2, Copy and paste into input frame.
3, Input pre-checking button to check input
4, After checking pass, select parameters, submit and download
2) How to cite?
9000+ papers in (Google Scholar)
Tang D, Chen M, Huang X, Zhang G, Zeng L, Zhang G, Wu S, Wang Y. SRplot: A free online platform for data visualization and graphing. PLoS One. 2023 Nov 9;18(11):e0294236. doi: 10.1371/journal.pone.0294236. PMID: 37943830.
3) FAQs