Read before use
1, check data with precheck (windows version) tools
2, data from excel, copy and paste data into the input frame
3, data from txt, must tab-seperated, copy and paste data into the input frame
4, specieal and non-English characters such as #, <, >, %, (, ), α are not friendly
5, use point as decimal separator, not comma. e.g. 3.14, not 3,14 as pi

Requied
Input data:


Optional
Figure size
figure width:
figure height:

Circle in column 1
transparent 1:
linewidth 1:
fill color 1:
labelled text fontsize 1:
labelled text color 1:

Circle in column 2
transparent 2:
linewidth 2:
fill color 2:
labelled text fontsize 2:
labelled text color 2:

Fontfamily


circle packing

Introduction
Draw circles according to values. Within the same levels, the areas of circles are proportional to values.
Input data instruction
Input data contains 2 columns: the first column is class and the second column is value
Input data contains 3 columns: the first colun is class, the second column is subclass and the third column is value of subclass.
note: subclass must be unique.
Example from papers
Input
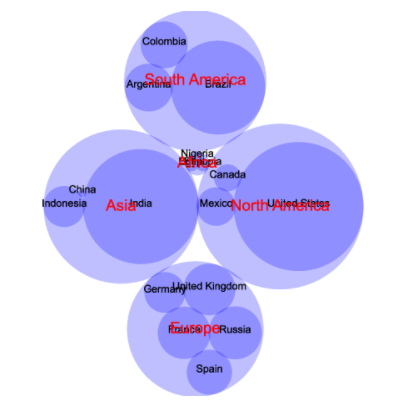
continent	country	COVID-19
North America	United States	37345854
North America	Mexico	3101266
North America	Canada	1455973
South America	Brazil	20378570
South America	Colombia	4870922
South America	Argentina	5088205
Europe	Germany	3845034
Europe	France	6471035
Europe	Russia	6621601
Europe	Spain	4719266
Europe	United Kingdom	6295613
Africa	Nigeria	182503
Africa	Ethiopia	289274
Africa	Egypt	285358
Asia	China	94430
Asia	India	32249900
Asia	Indonesia	3871738
Output

1) How to plot?
1, Prepare data
2, Open with excel, and change into the same format as the example
3, Copy and paste data into the input frame
4, Select parameters
5, Submit and download figure files

2) Why NO figure generated?
Script need strigent input format, please read the instructions and examples carefully.

3) How to cite?
2000+ papers in (Google Scholar)
Tang D, Chen M, Huang X, Zhang G, Zeng L, Zhang G, Wu S, Wang Y. SRplot: A free online platform for data visualization and graphing. PLoS One. 2023 Nov 9;18(11):e0294236. doi: 10.1371/journal.pone.0294236. PMID: 37943830.

4) FAQs