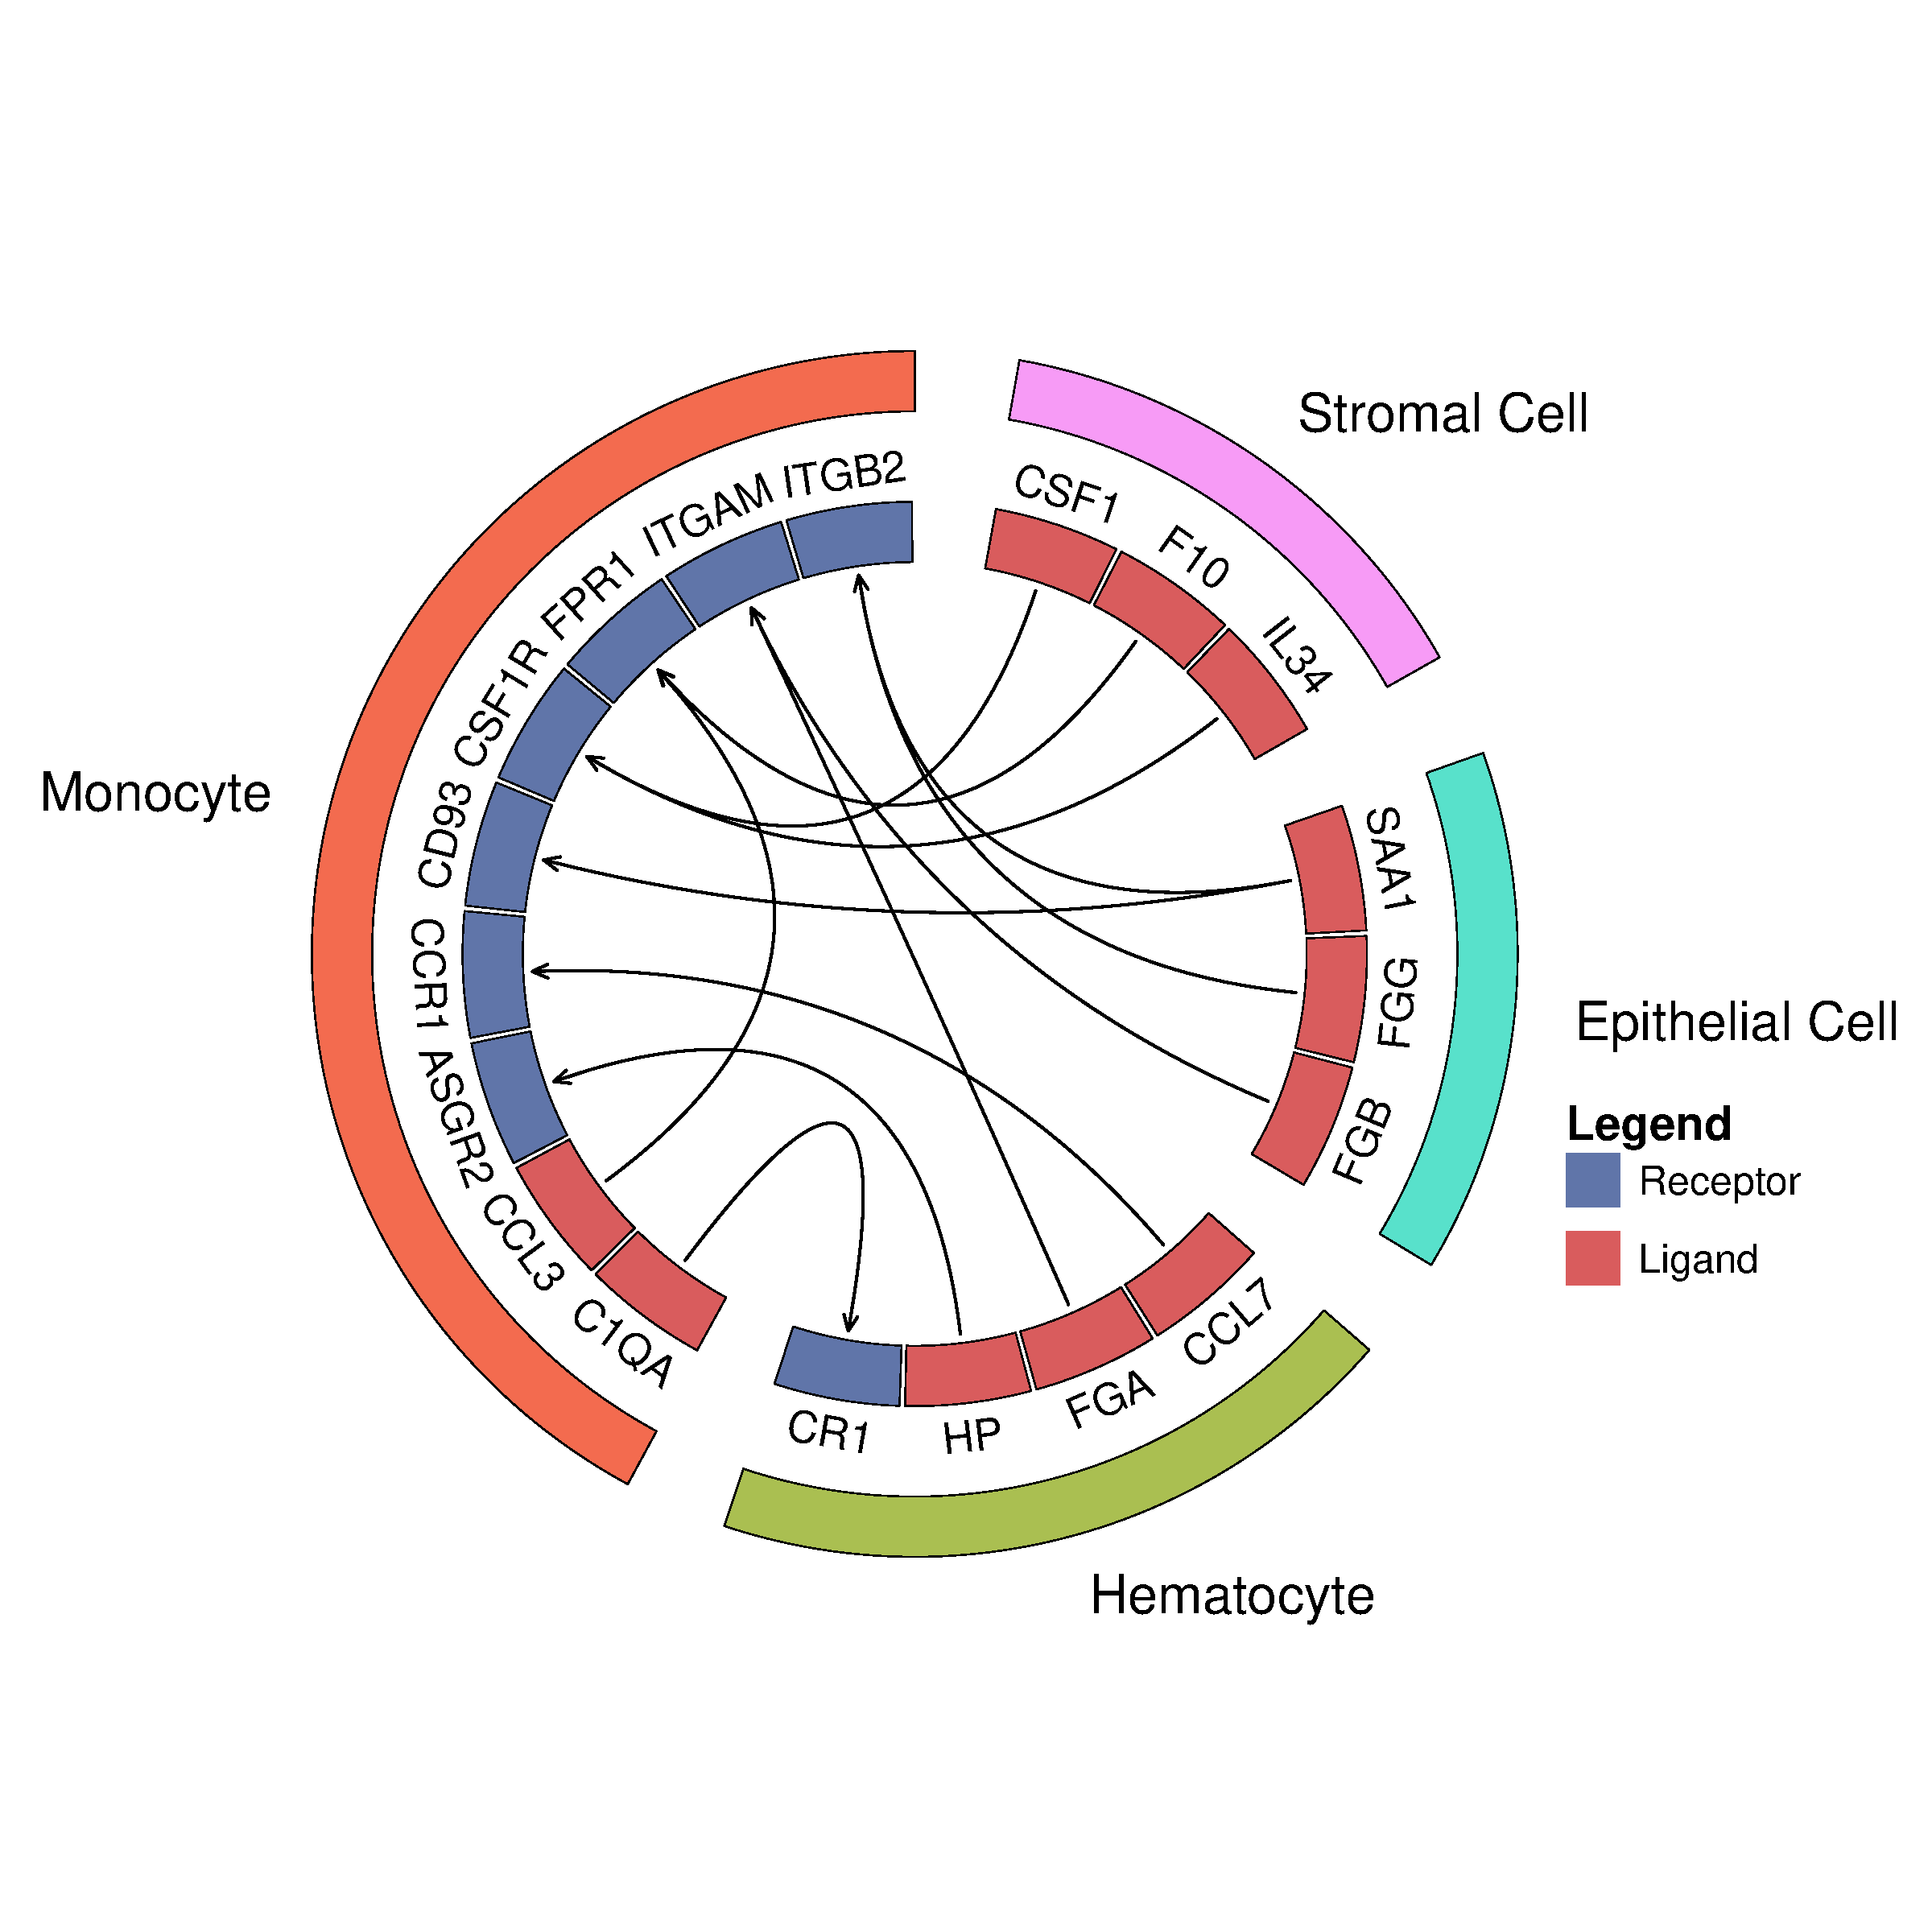
细胞通讯受体-配体对circos图
简介
使用circos图展示细胞通讯受体-配体对。外圈是细胞类型,内圈是受体-配体对
数据说明
输入数据包括2个:1)受配体对。输入是2列,第1列是受体,第2列是配体,一行是一对,对应内圈的箭头线
2)基因-受/配体类型-细胞类型。输入是3列,第1列是基因名,第2列是受体或者配体的类型,第3列是外圈的细胞类型。
论文例子
Single Cell Atlas: a single-cell multi-omics human cell encyclopedia
论文写作
Top receptor-ligand interactions between cell type classes in adult tissues (left) and fetal tissues (right). Color blocks on the outer circle represent the cell type class, and the color in the inner circle represents the receptor (blue) and ligand (red). Arrows indicate the direction of receptor-ligand interactions.
如何引用?
建议直接写网址。助力10000+篇
(google学术),9500+篇
(知网)论文
正式引用:Tang D, Chen M, Huang X, Zhang G, Zeng L, Zhang G, Wu S, Wang Y.
SRplot: A free online platform for data visualization and graphing. PLoS One. 2023 Nov 9;18(11):e0294236. doi: 10.1371/journal.pone.0294236. PMID: 37943830.
方法章节:Heatmap was plotted by https://www.bioinformatics.com.cn (last accessed on May 4, 2026), an online platform for data analysis and visualization.
致谢章节:We thank Mingjie Chen (Shanghai NewCore Biotechnology Co., Ltd.) for providing data analysis and visualization support.