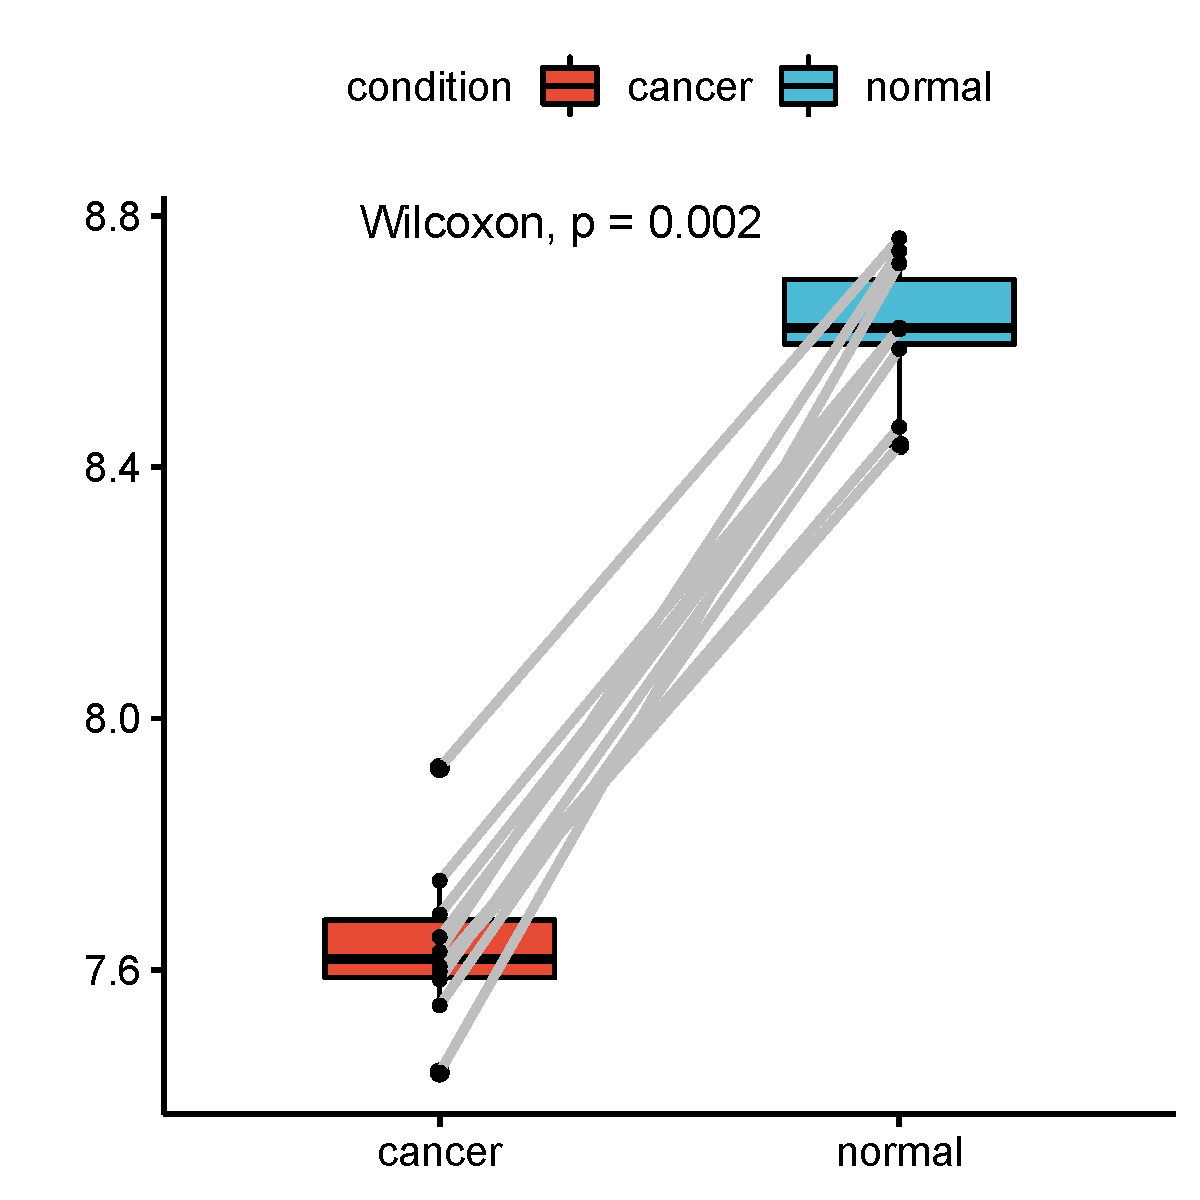
带连线的配对box图
简介
在box的基础上,将配对的点连起来。调用ggpubr包
数据说明
三列,第一列是样品,第二列是cancer中的值(例如SLC25A17基因表达值),第三列是normal中的值(例如SLC25A17基因表达值)
论文例子
Multiomics data analyses to identify SLC25A17 as a novel biomarker to predict the prognosis and immune microenvironment in head and neck squamous cell carcinoma Fig 1C
论文写作
For each patient, tumor tissues generally showed lower expression levels of SLC31A1 than normal tissues, based on data from TCGA database. Y-axis represents log2 (TPM) values of SLC31A1 expression of samples.
如何引用?
建议直接写网址。助力10000+篇
(google学术),8500+篇
(知网)论文
正式引用:Tang D, Chen M, Huang X, Zhang G, Zeng L, Zhang G, Wu S, Wang Y.
SRplot: A free online platform for data visualization and graphing. PLoS One. 2023 Nov 9;18(11):e0294236. doi: 10.1371/journal.pone.0294236. PMID: 37943830.
方法章节:Heatmap was plotted by https://www.bioinformatics.com.cn (last accessed on May 4, 2026), an online platform for data analysis and visualization.
致谢章节:We thank Mingjie Chen (Shanghai NewCore Biotechnology Co., Ltd.) for providing data analysis and visualization support.