冲积图(alluvial plot)
简介
流量图的一种展示方式,一般用来展示从属关系或者网络结果。
数据说明
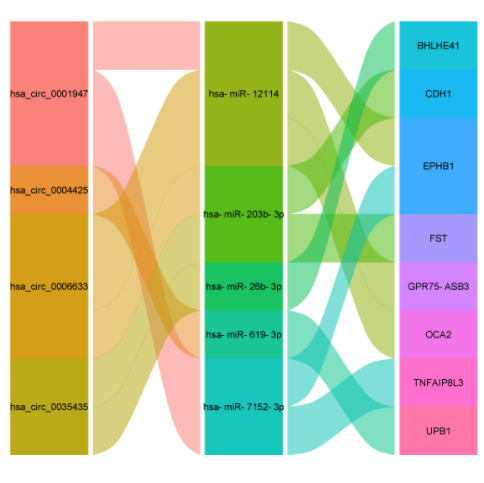
输入数据至少包括两列,从属关系。例如用来绘制ceRNA时数据包括3列:circRNA-miRNA-mRNA。也可以推广到其他具有网络性质的数据上。默认按照字母顺序,如果想自定义顺序,请各列元素前面添加数字前缀,出图后再使用编辑软件去掉前缀即可
例如hsa_circ_0001947改成2hsa_circ_0001947,hsa_circ_0006633改成1hsa_circ_0006633,hsa_circ_0035435改为4hsa_circ_0035435,hsa_circ_0004425改为3hsa_circ_0004425。则第一列从上到下依次为:1hsa_circ_0006633,2hsa_circ_0001947,3hsa_circ_0004425,4hsa_circ_0035435。注意:并非所有的列都可以按照这种方式来修改,因为程序会根据面积自动布局。
文章例子
A Novel Network Pharmacology Strategy to Decode Metabolic Biomarkers and Targets Interactions for Depression. Fig 6
如何引用?
建议直接写网址。助力10000+篇
(google学术),9000+篇
(知网)论文
正式引用:Tang D, Chen M, Huang X, Zhang G, Zeng L, Zhang G, Wu S, Wang Y.
SRplot: A free online platform for data visualization and graphing. PLoS One. 2023 Nov 9;18(11):e0294236. doi: 10.1371/journal.pone.0294236. PMID: 37943830.
方法章节:Heatmap was plotted by https://www.bioinformatics.com.cn (last accessed on May 4, 2026), an online platform for data analysis and visualization.
致谢章节:We thank Mingjie Chen (Shanghai NewCore Biotechnology Co., Ltd.) for providing data analysis and visualization support.