PCR vs RNA-seq表达双Y坐标轴图
数据说明
PCR数据包括3列,第一列是名字,第二列是表达值,第三列是标准误(即:excel里边的stdev(PCR重复值array)/sqrt(重复数),其中第一行第一列内容作为PCR legend文字
RNA-seq数据包括2列,第一列是名字,第二列是表达值,其中第一行第一列内容作为RNA-seq legend文字
论文例子
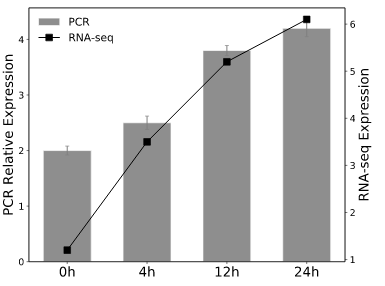
PCR-RNA-seq双Y轴,展示两者结果的一致性
| PCR输入 |
PCR	expression	stdev
0h	2	0.08
4h	2.5	0.12
12h	3.8	0.09
24h 4.2 0.15 |
| RNA-seq输入 |
RNA-seq	expression
0h	1.2
4h	3.5
12h	5.2
24h 6.1 |
| 输出 |
|
如何引用?
建议直接写网址。助力10000+篇
(google学术),8500+篇
(知网)论文
正式引用:Tang D, Chen M, Huang X, Zhang G, Zeng L, Zhang G, Wu S, Wang Y.
SRplot: A free online platform for data visualization and graphing. PLoS One. 2023 Nov 9;18(11):e0294236. doi: 10.1371/journal.pone.0294236. PMID: 37943830.
方法章节:Heatmap was plotted by https://www.bioinformatics.com.cn (last accessed on May 4, 2026), an online platform for data analysis and visualization.
致谢章节:We thank Mingjie Chen (Shanghai NewCore Biotechnology Co., Ltd.) for providing data analysis and visualization support.
