
test account: test Password: bio123456)
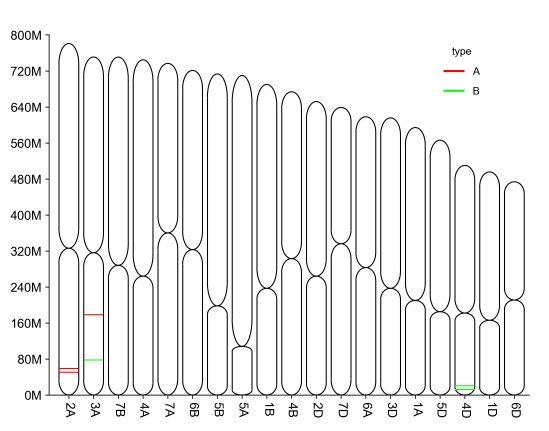
| Chromosome length | 2A 780798557 326000000 3A 750843639 316000000 7B 750620385 288000000 4A 744588157 264000000 7A 736706236 360000000 6B 720988478 323000000 5B 713149757 198000000 5A 709773743 108000000 1B 689851870 237000000 4B 673617499 303000000 2D 651852609 264000000 7D 638686055 336000000 6A 618079260 283000000 3D 615552423 237000000 1A 594102056 210000000 5D 566080677 185000000 4D 509857067 182000000 1D 495453186 166000000 6D 473592718 211000000 |
| Genomic location | chrom pos type 2A 50602155 A 2A 58861277 A 3A 178099541 A 3A 77794217 B 4D 20732565 B 4D 11935999 B |
| Output |
|
1) How to plot?
1, Prepare data
2, Open with excel, and change into the same format as the example
3, Copy and paste data into the input frame
4, Select parameters
5, Submit and download figure files
2) Why NO figure generated?
Script need strigent input format, please read the instructions and examples carefully.
3) How to cite?
2000+ papers in (Google Scholar)
Tang D, Chen M, Huang X, Zhang G, Zeng L, Zhang G, Wu S, Wang Y. SRplot: A free online platform for data visualization and graphing. PLoS One. 2023 Nov 9;18(11):e0294236. doi: 10.1371/journal.pone.0294236. PMID: 37943830.
4) FAQs